« back published by @mmartin_joo on April 30, 2024
Designing an Analytics Platform
In this article, we're going to discuss the system design of an analytics platform such as Fathom, SplitBee, or Google Analytics. I'll use SplitBee as an example but the main principles and the performance issues are similar across all these platforms. If you don't know too much about these apps, here's an executive summary for you:
- You include a script provided by Splitbee into your website
- Whenever a user visits a page on your site, the script sends a request to Splitbee
- When you log into Splitbee you'll see an overview of your traffic
This is what the dashboard looks like:
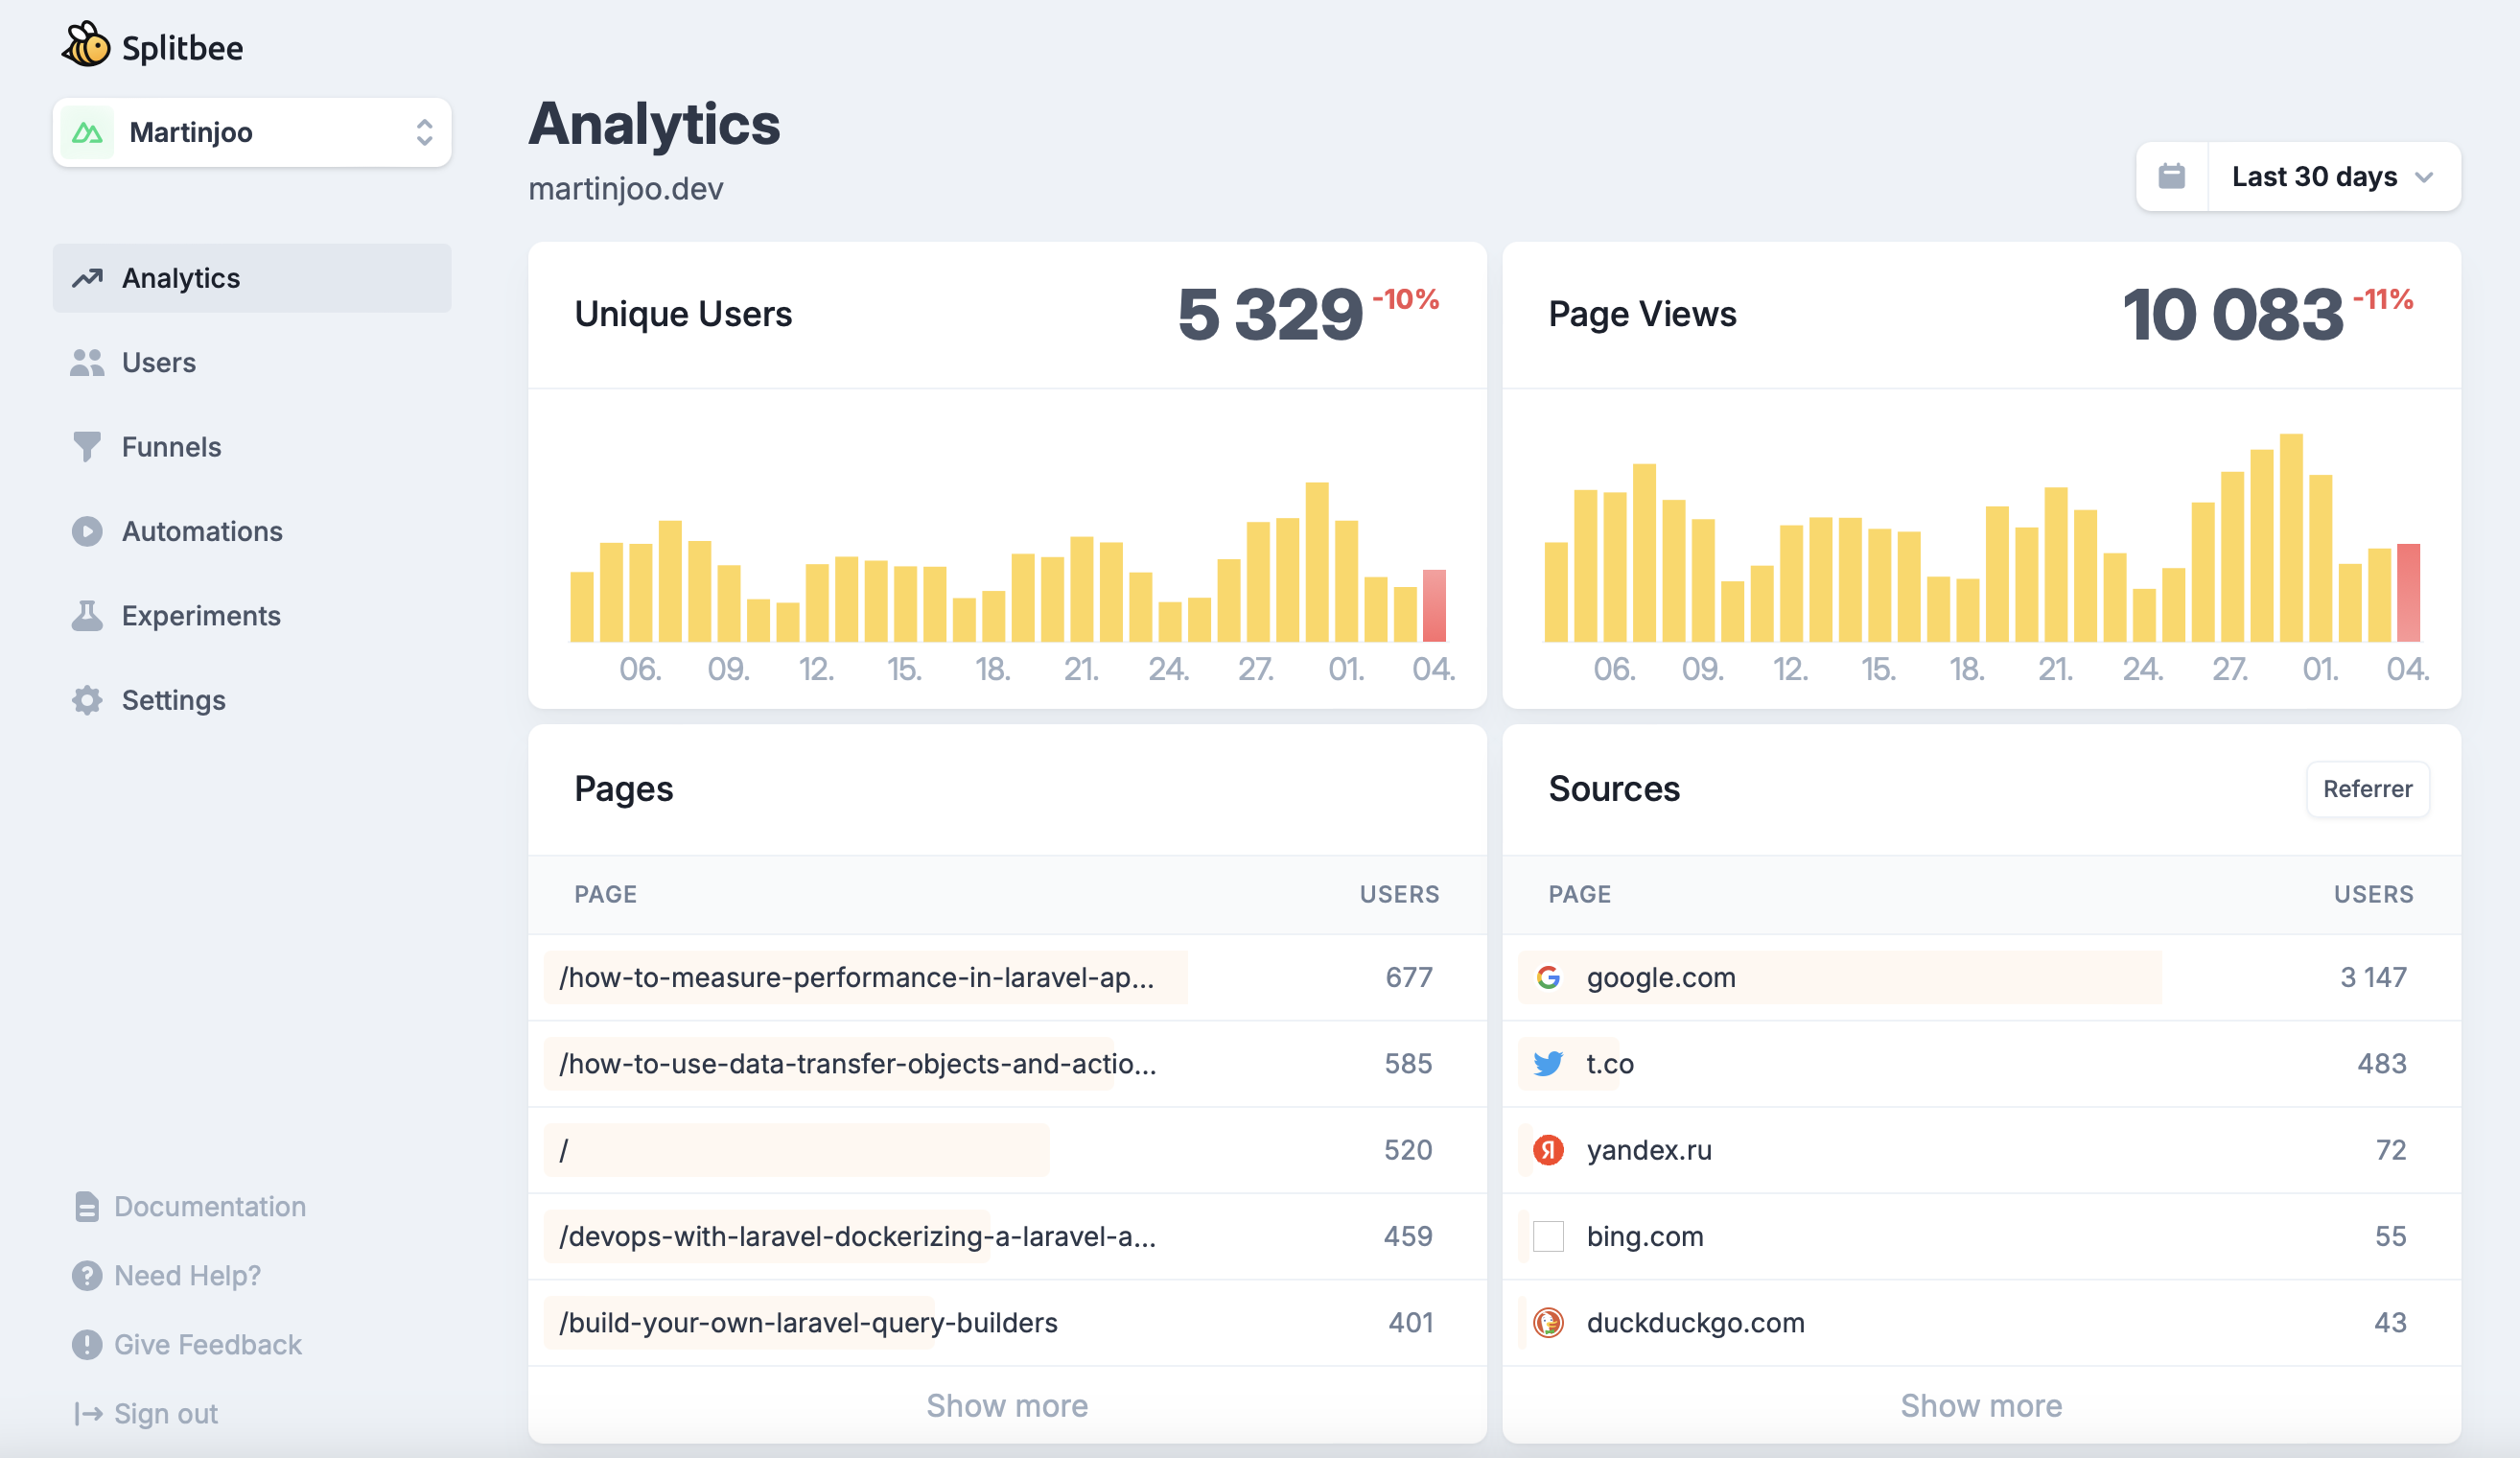
There are two important terms:
- Page views: if you go to a site and visit three pages it counts as three page views
- Unique users: it might be three page views but there's only one user, you.
It also shows the most visited pages in a given time period and the sources of the traffic.
There's a date filter where you can select options such as: last 24 hours, last 7 days, etc. We're going to copy all these features except traffic sources. It's not related to performance at all, so it's not interesting for us now.
You probably already thinking about GROUP BY and COUN(*) queries but let's take a step back first.
For the first part of this chapter exact traffic numbers are not that important. Let's just assume that the database contains 10,000,000 page view records and we need to handle 100,000 requests a day.
v1
If we want to build a reliable analytics platform that handles high load we can't just do that:
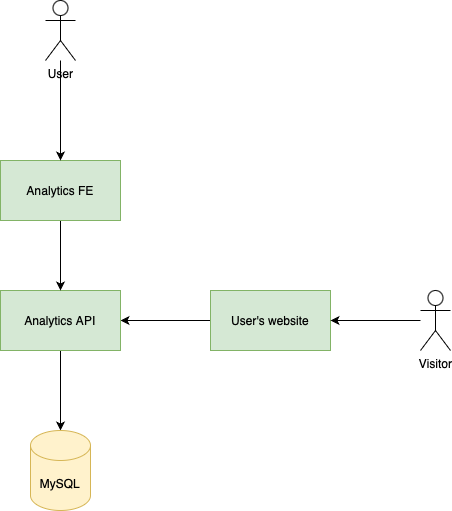
This is a "standard aproach" where we have an API that accepts HTTP requests from the scripts embedded into users' websites, saves them into a database and then serves them to a frontend.
For simplicity, I'll use the following terms:
- When a user uses the dashboard via the frontend it's a user request
- When a user' website sends an HTTP request it's a website requests
This aproach won't work very well for a few reasons:
- The number of website requests is extremely high
- Having the same server to serve user and website requests is probably a bad idea
- MySQL will store many millions of rows and there's a good chance that aggregated queries made by user requests will be quite slow. Meanwhile, the databse has to constantly run INSERT queries because of the incoming website requests. Having a huge database that needs to handle a big number of write and read queries as well is probably not a good idea. For example, if you index your database right then reading will be faster but writing is going to be slower as mentioned in the database index chapter.
- If we have only one instance of the API it's a huge single point of failure. If it's down, everthing is down. If it's slow, everything is slow.
- If we have only one instance of the API and it's down then incomoing requests in this period cannot be easliy "replayed" later. So the data is lost.
v2
Of course, the low hanging fruit is to scale the API up:
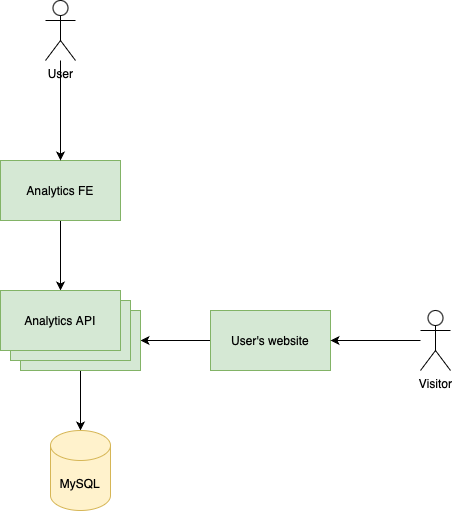
Horizontally scaling the API is a must-have in this application. It means that we run multiple instances of the API and a load balancer balances the incoming traffic across the instances.
This way we elimanted the single point of failure problem, right? Let's think about two kinds of problems:
- Assume, we have autoscaling, meaning that the number of instances can grow as incoming traffic grows. Let's say traffic grows pretty quickly and instance #1 is overloaded and is out of memory. The autoscaler spins up new instances and future traffic goes to them. But what happened with the requests handled by instance #1? Let's say there were 20 requests being processed when it ran out of memory. What happened to them? It's hard to say, maybe some of them were processed successfuly maybe not. We don't know that exactly. I mean, it's not a huge concern and is probably acceptable but still there's some unreliability here. Unfinished requests are probably lost as well.
- But now let's imagine we have a pretty uggly bug in the code. After the controller accepts the request but before we execute the
INSERTstatement there's a bug that causes an exception so the request fails. In this it doesn't matter how many replicas you have. All the incoming requests are lost until the bug is present. Of course, you can recover them from nginx access logs or an audit table but it's going to be a pretty bad evening.
Even if we have infitnite scale the API can still cause some pretty bad problems.
Another problem is that we should not treat user requests and website requests with the same priority. Even if we scale the API, the database can still experience high latency periods. Right now, if there are hunders of incoming website requests (keeping MySQL ocupied) and then a user wants to see the dashboard he/she might experiences very high latency. In this scenario, the user request should clearly have higher priority. It doesn't really matter if the application processes a website requests right now, or 3 seconds from now.
v3
The source of these issues is the absence of a job queue and workers:
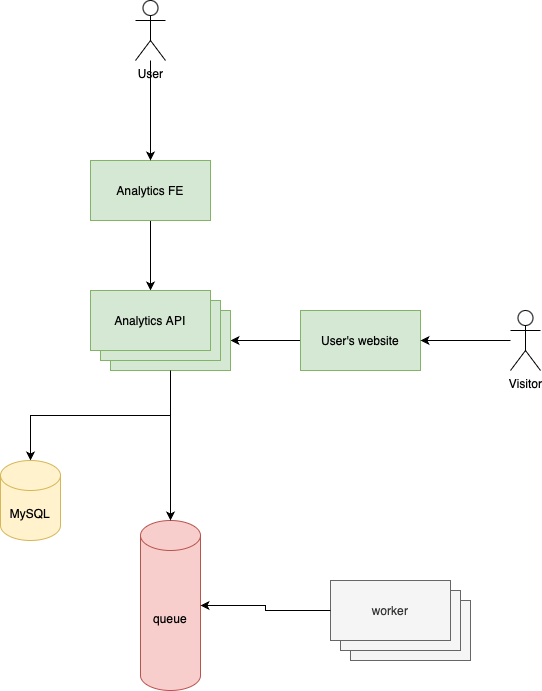
Review the three problems from v2:
- Data loss is possible when the traffic is growing faster than the autoscaler. This issue is very very unlikely now. The API only accepts the incoming website requests and then immediately dispatches a job to a queue. So even is the load is super high, these requests now consume significantly less CPU and memory. The probablitiy that the queue is out of memory, or space, or CPU is pretty low if we choose the right technology and/or resource. If the worker runs out of resources the job will fail and will be put in the
failed_jobstable and can be processed later. So data loss and outage is significantly less now. - The code that inserts the page view records has a fatal bug. In this case, job will fail and will be put in the
failed_jobstable and can be processed later. The worst case scenario is that we cannot insert new rows until the bug is present so users will see outdated data on the dashboard. The situation is much better compared to v2. - The third problem was that we treated user and website requests with the same priority. We can now easily prioritize user requests over workers by specifiyng a
nicevalue (as we discussed in the queue chapter). However, it's still a problem since there's a possibility that there are 100 workers inserting into the database at the exact moment when a user wants to see the dashboard. Or maybe 500 users at the same time. We can usenicevalues but they won't "re-priorizite" already running processes.
v4
One solutin to the last problem is using a very fast cache-like database to serve user requests:
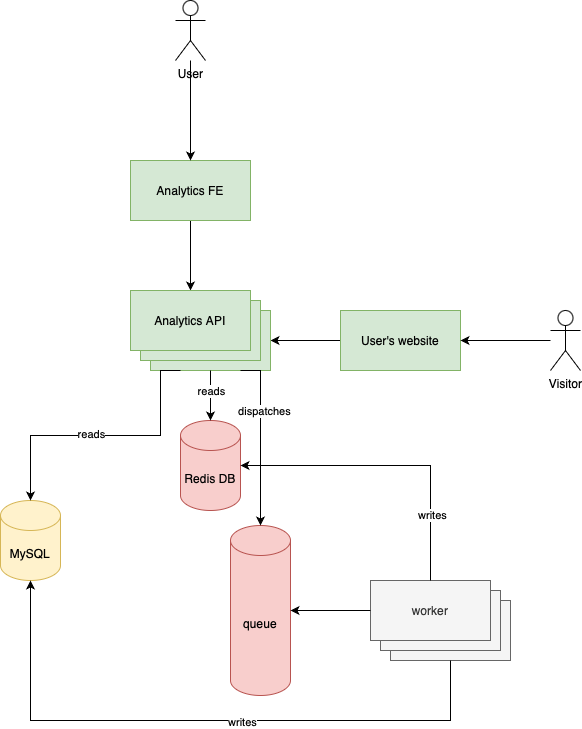
It's getting more and more complicated so here's a summary of how this design handles incoming website requests:
- The embedded script on the user's webstie sends an HTTP request to the API
- The API dispatches a job
- The worker inserts the new record into MySQL
- It also updates a cache-like Redis database
- When a user requests the dashboard the API reads it from Redis. If data is not available it reads it from MySQL
By maintaining a Redis DB to serve user requests we made the whole application significantly faster. Like order of magnitudes faster. Later, I'm going to show you exact numbers. Another note is that most developers think about Redis as a key-value cache where we set a string key and a string value (just as Cache::set('key', 'value') works). However, it's a much more complicated database engine. We'll use different data structures to make this cache-like database as efficient as possible. But it's going to be a bit more complicated than a typical cache.
There's still a problem with this design, in my opinion. We still use the same component to handle user and website requests. The analytics API. These are two completely different scenarios. They scale differently. In an application that handles millions of requests you just can't risk to bring your entire frontend (user requests) down because of your background processes (website requests). And it's true vice versa. You cannot hurt background processes because of a spike in frontend traffic caused by a new marketing campaign. In my opinion, at least.
Another "issue" is that we bootstrap an entire Laravel application with 63MB of vendor code just to accept a request and dispatch a job. Of course, you can always install Ooctane if you have the knowledge in your team. But often people don't have experience with it. By extracting it out into a new component you can easily write 50 lines of node or go to handle such a small but crucial task.
v5
To solve these issues we can extract out a new component called "PageView API:"
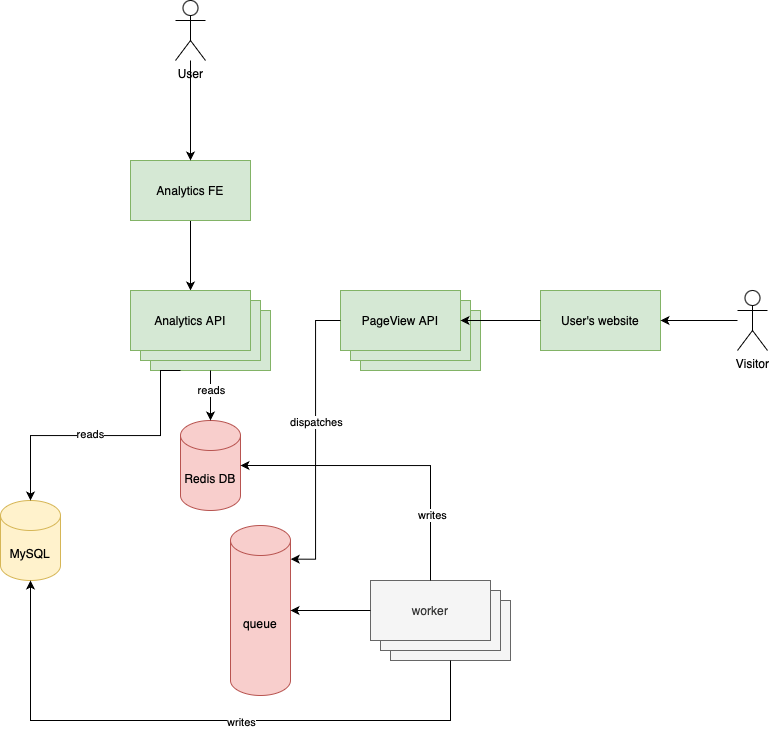
Do you see what we just did? We completly disconnected the Analytics API from website requests.
Now we can:
- Monitor them separately. It's a big win because the two service has completly difference traffic and load patterns.
- Optimize them based on their specific problems.
- Scale them differently. It's a big win because the PageView API will get significantly more traffic than the Analytics API.
- Implement the PageView API in node or go. Or use Octane. For example, if you don't have too much production experience with it (as most developers don't, I think) it's better to try it out in one isolated service that won't risk your entire application, only a part of it.
Now it's much better, more reliable architecture than before. If you now take a look at it, can you spot the remaining single point of failures? Yes, the queue and the database. They'll both have an extraordinary amount of load so it's probably best to use some sort of managed service instead of spinning up our own Redis instance on a $20 VPS.
v6
There's one problem with the previous architecture: the two services share the same database. PageView API writes into MySQL (using workers) and the Analytics API reads from it. But the Analytics API also writes data into it. For example, registering users, creating sites.
This is problematic for a few reasons:
- First of all, who will migrate the database? It doesn't seem like a big deal, but imagine you're working on the PageView API you want to add a new column and there is no migration for the
page_viewstable. You need to go to another service to add a column that you will use in another service? On top of that, you need to make a rule. A. rule about which service will run migrations. And every developer on the team needs to follow that rule. It's confusing. - Tight coupling and low cohesion. Imagine you're working on the Analytics API and you need to change the schema. For example, renaming a column. You can break the entire PageView API without even noticing it.
- These problems lead to shared responsibility. You don't really know who's in charge of the database which leads into even more trouble. Imagine if you have 6 services.
These problems are not strictly related to performance. These are microservice and distributed system problems. I'll cover the possible solutions and show you some code examples. If you want to read more about these topics check out this and this article.
The solution to this one-database-two-services problem is CQRS. It stands for Command Query Responsibility Segregation. There are three important terms here:
- Command is a write operations such as a MySQL
insert - Query is a read operation such as a
selectstatement - Segregation means that CQRS likes to separate the two
It means that we have two separate databases for write and read operations. At first, it souds weird so let me put it into context:
- The PageView API only writes data to a MySQL database
- The Analytics API only read data from a Redis database
- The two system communicates via an event stream (don't worry about it for now, there are going to be examples later)
Whenever a new page view happans the PageView API writes it into MySQL and dispatches a PageViewCreated event to an event store. The Analytics API reads the event store for new events and builds its own database. In this case it's a Redis DB with sorted sets and HyperLogLogs. In other cases, it could be another MySQL database, a Mongo DB or any other engine. In this specific application the PageView API would have another MySQL database to store users and sites. Or you can extract out a third service called User API that has its own database with user information.
What's the benefit of CQRS?
Storing data in a row-based format (MySQL in this example) is an excellent solution.
The problems comes when you want to read it. Users don't want to look at row-based data on a UI. They want charts, infographics, visual stuff, aggregated reports, etc. Generating these data structures from a row-based format is not always a great idea. We've seen this. Without spending serious effort on optimization some of the queries took 6.5s to run. After optimization queries become much more complicated. You can easily spend days if not weeks on improving the performance. And the root cause of the problem almost always boils down to the single fact that the raw data in the table is so far from what users want to see on the UI.
If it's so bad then why did I say this? "Storing data in a row-based format (MySQL in this example) is an excellent solution." Because it's true. We can store the data in MySQL and then generate hunders of different aggregated reports out of it using Redis, Mongo or other document store.
The PageView API stores the data in MySQL as a single source of truth and the Analytics API builds its own "pre-processed" data in Redis. This way, we have the following benefits:
- Querying data is super fast. The data structures are all optimized for how the users want to see them. It's not raw anymore, it's pre-processed for the exact use case of the Analytics API.
- Storing data is easy and "raw." Meaning we can add any number of new services in the future. They can build their own specialized databases using the raw-based data.
Put it into other words: we separate the read and write operations to optimize the app.
This is how the architecture can be imagined as:
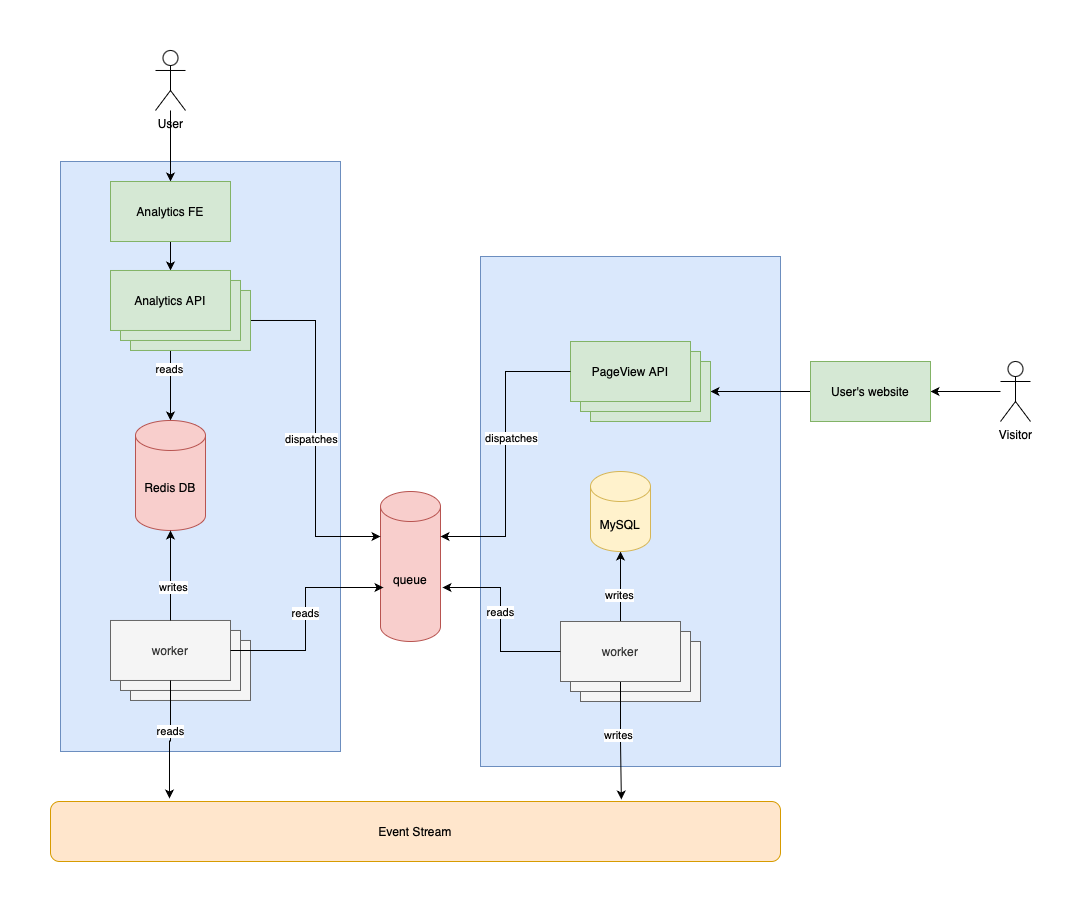
It looks confusing at first but here are the most important changes:
- The PageView API writes page views into its own MySQL database (using a queue and workers)
- The Analytics API doesn't communicate with MySQL anymore
- On a scheduled basis (for example every minute) it dispatches a job
- This job reads new events from the event stream
- And writes these new events into Redis using the same techinuques we've seen earlier
This way we have two completely separated databases with two different responsibilities:
- MySQL stores the raw data as it is.
- Redis stores a "pre-processed" version of the page views that are optimized for the Analtics API's charts
- The event stream acts as a communication layer between the two services
I added these blue rectangles to the image. They represent service bounderies. You can see that Redis is now owned by the Analytics API and MySQL is owned by the PageView API. These are two separate subsystems with many components. The event stream is not owned by anyone which is important. It's an independent communication layer.
The event stream
Redis is an excellent choise for an event stream. It's easy to learn, fast, has a high troughput and it's probably already in your tech stack which is very important in my opinion. I don't think you should learn Kafka or RabbitMQ just to have an event stream.
There's a data type in Redis called stream. You can imagine it as a huge log file with timestamps at the beginning of every line. Each line represents an entry in the stream. An entry is a hash or an associative array with fields and values. We'll have only one field called data and the value will be the JSON representation of a PageView record.
An event stream looks like this:
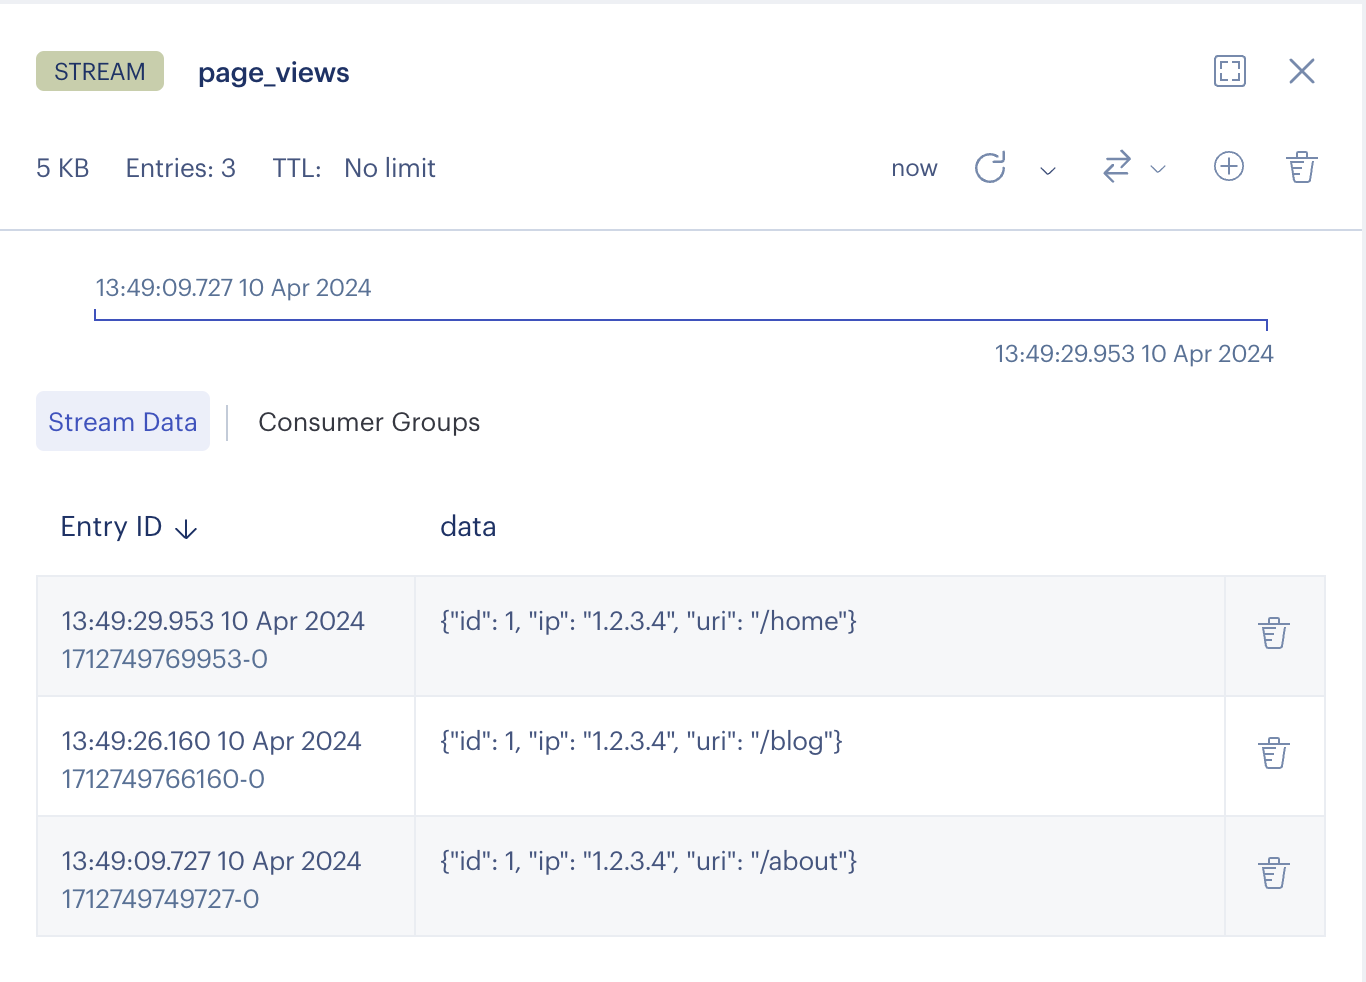
The three lie represents three different page views happened between the 10th of April, 2024 13:49:09 and 13:49:29. In the Entry ID column you can see the human readable time. This is something RedisInsight does. In the stream itself there only the timestamp-based IDs such as 1712749769953-0. It contains the timestamp and an integer identifier (0 in this case). If more than one entry is created at the same time they will get IDs such 1712749769953-0, 1712749769953-1, and so on.
We can add new entries to the stream with the xadd command:
xadd page_views * data "{\"id\": 1, \"ip\": \"1.2.3.4\", \"uri\": \"/home\"}"
data is the field and the JSON string is the value. * is used if you don't want to set an ID manually. In that case, Redis will set it for you.
This is the command the PageView API needs to execute:
namespace App\Jobs;

class SavePageViewJob implements ShouldQueue
{
  use Dispatchable, InteractsWithQueue, Queueable, SerializesModels;

  public function __construct(private readonly PageViewData $data)
  {
  }

  public function handle(): void
  {
    $pageView = PageView::create([
      'browser' => $this->data->browser,
      'device' => $this->data->device,
      'ip' => $this->data->ip,
      'visited_at' => $this->data->visited_at,
      'site_id' => $this->data->site_id,
      'uri' => $this->data->uri,
    ]);

    $eventStream = Redis::connection('event_stream');

    $eventStream->xadd('page_views', ['data' => json_encode($pageView)]);
  }
}
For my new book, Performance with Laravel, I wanted to show the system design and the implementation of a complex system so I decided to build an analytics platform. This article is the introduction. It is a 110-page chapter right now. Quite detailed.