« back published by @mmartin_joo on January 29, 2024
How to Measure Performance in Laravel Apps
Before we start optimizing performance we need ways to effectively measure it. But even before we can measure it we need to know what exactly we want to measure.
Here are some of the most important performance measures of an API/backend service:
- Throughput: the number of requests the system can handle without going down.
- Load time: the amount of time it takes for an HTTP request to respond.
- Size: the total size of the HTTP response.
- Server uptime: the duration of time the server is up and running usually expressed as a percentage.
- CPU usage: the amount of CPU your system needs to run. It is usually expressed as load average which I'm gonna explain later.
- Memory usage: the amount of memory your system uses.
In this article, we're going to talk about backend and APIs but of course there are some frontend-related metrics as well:
- Load time: the amount of time it takes for the full page to load.
- First byte: the time taken to start loading the data of your web application after a user requests it.
- Time to interactive: this measures how long it takes a page to become fully interactive, i.e., the time when layout has stabilized, key web fonts are visible, and the main thread is available enough to handle user input.
- Page size: the total size of the web page, that includes all of its resources (HTML, CSS, JavaScript, images, etc).
- Number of requests: the number of individual requests made to the server to fully load the web page.
These things are "black box measures" or "external measures." Take load time for an example and say the GET api/products endpoint took 912s to load which is slow. Measuring the load time tells you that your system is slow, but it doesn't tell you why. To find out the cause we need to dig deeper into the black box. We need to debug things such as:
-
Number of database queries
-
The execution time of database queries
-
Which function takes a long time to finish its job?
-
Which function uses more memory than it's supposed to?
-
What parts of the system can be async?
-
and so on
Measuring a system from the outside (for example load time of an API endpoint) is always easier than measuring the internal parts. This is why we start with the external measures first.
ab
The easiest tool to test your project's performance is ab or Apache Benchmark. It's a command line tool that sends requests to a given URL and then shows you the results.
You can use it like this:
ab -n 100 -c 10 -H "Authorization: Bearer 1|A7dIitFpmzsDAtwEqmBQzDtfdHkcWCTfGCvO197u" http://127.0.0.1:8000/api/transactions
This sends 100 requests to http://127.0.0.1:8000/api/transactions with a concurrency level of 10. This means that 10 of those requests are concurrent. They are sent at the same time. These concurrent requests try to imitate multiple users using your API at the same time. It will send 10 requests at a time until it reaches 100.
Unfortunately, in ab we cannot specify the ramp-up time. This is used to define the total time in which the tool sends the requests to your app. For example, "I want to send 100 requests in 10 seconds." You cannot do that with ab. It will always send requests when it can. So if the first batch of the concurrent requests (which is 10 requests in this example) is finished in 3 seconds then it sends the next batch and so on. Other than that, it's the perfect tool to quickly check the throughput of your application.
And now, let's interpret the results:
Concurrency Level:      10
Time taken for tests:   2.114 seconds
Complete requests:      100
Failed requests:        0
Total transferred:      1636000 bytes
HTML transferred:       1610100 bytes
Requests per second:    47.31 [#/sec] (mean)
Time per request:       211.363 [ms] (mean)
Time per request:       21.136 [ms] (mean, across all concurrent requests)
Transfer rate:          755.88 [Kbytes/sec] received
As you can see, it sent a total of 100 requests with a concurrency level of 10. The whole test took 2114ms or 2.114 seconds. If we divide 100 with 2.114 seconds the result is 47.31. This is the throughput of the server. It can handle 47 requests per second.
These tests were made on my MacBook with a pretty simple API endpoint, so they are quite good.
The next two numbers were quite hard to me to understand at first. They are:
Time per request: 211.363 [ms] (mean)Time per request: 21.136 [ms] (mean, across all concurrent requests)
When you run ab -n 100 -c 10 ab creates 10 request "groups" that contains 10 requests each:
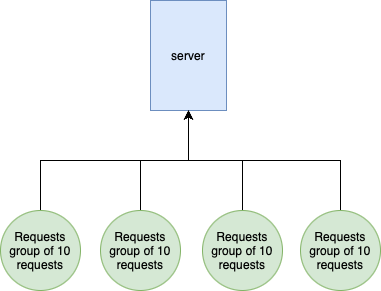
In this case Time per request: 21.136 [ms] (mean, across all concurrent requests) means that 1 request took 21ms on average. This is the important number.
The other Time per request: 211.363 [ms] (mean) refers to a request group. Which contains 10 requests. You can clearly see the correlation between these numbers:
- Time taken for tests: 2114 ms
- All 100 requests took a total 2114 ms
- Time per request: 21.136 [ms] (mean, across all concurrent requests)
- 2114 ms / 100 requests = 21.14 ms per request
- One request took 21.14 ms on average
- Time per request: 211.363 [ms] (mean)
- 2114 ms / 100 requests * 10 = 211.4 ms
- One request group of 10 requests took 211 ms on average
So if you use concurrency the last number doesn't really make sense. It was really confusing for me at first, so I hope I gave you a better explanation.
ab is a fantastic tool because it is:
- Easy to install
- Easy to use
- You can load test your app in minutes and get quick results
But of course it has lots of limitations.
jmeter
The next tool to load test your application is jmeter. It has more advanced features than ab including:
- Defining ramp-up period
- Building a "pipeline" of HTTP requests simulating complex user interactions
- Adding assertions (response validation) to your HTTP tests
- Better overview of your app's performance
- Test results visualization using charts, graphs, tree view, etc.
- Other useful testing features such as XPath, regular expression, JSON, script variables, and response parsing, which help to build more exact and effective tests.
- GUI
A quick note. If you're having trouble starting jmeter try this command with the UserG1GC argument: java -XX:+UnlockExperimentalVMOptions -XX:+UseG1GC -jar ApacheJMeter.jar. You can also use this alias: alias jmeter='JVM_ARGS="-XX:+UnlockExperimentalVMOptions -XX:+UseG1GC" /path/to/jmeter/bin/jmeter'
To start load testing with jmeter you need to create a new Thread group that has the following options:
Number of threadsrefers to the number of users or put it simply, the number of requests.Ramp-up perioddefines how much time should jmeter take to start the requests. If 10 threads are used, and the ramp-up period is 100 seconds, then jmeter will take 100 seconds to get all 10 threads up and running. Each thread will start 10 (100/10) seconds after the previous thread was begun.- And then we have
Loop count. By default it's 1 meaning that jmeter runs your HTTP tests once. If you set to 100 it repeats all of the tests a 100 times.
Inside the Thread group we need to add an HTTP Sampler which can be found inside the Sampler category. An HTTP request is pretty straightforward. You just need to configure the base URL, the endpoint, and query or POST body parameters if you have any.
In order to measure the results we need to add Listeneres as well. These are the components that can display the results in various formats. Two of the most crucial listeners are the Summary Report and the View Results Tree. Add them to the Thread group.
Summary report looks like this:
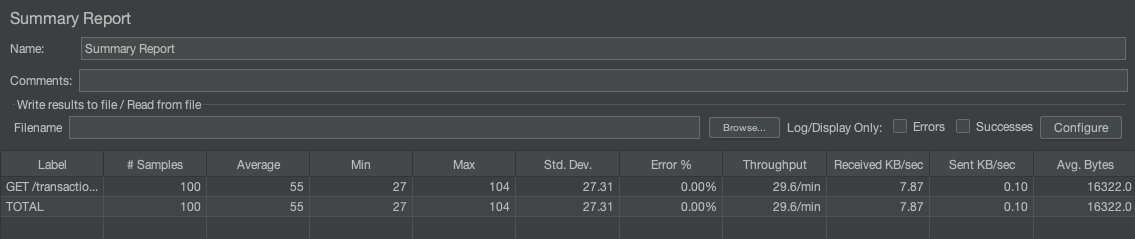
These are very similar metrics to ab:
- Average: the average response time in ms
- Median: the median (50th percentile) response time
- Max: the slowest response time
- Std. Dev,: it's the standard deviation during the test. In general, standard deviation shows you the amount of variation or dispersion of a set of values. In performance testing, the standard deviation indicates how much individual sample times deviate from the average response time. In this example, 27 indicates that the individual sample times in the dataset are, on average, 27 units away from the mean of the dataset. This means that there is a relatively high level of variability or dispersion in the sample times.
- Error%: the percentage of requests that resulted in an error (non-2xx)
- Throughput: the number of requests per minute that can be served by the server
- Received KB/Sec: the amount of data received per second during the test.
So the summary reoprt gives you a quick overview of the overall results of your tests.
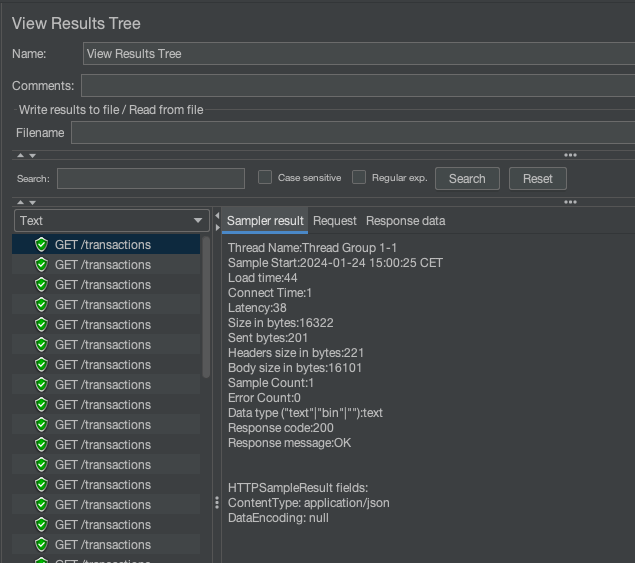
View Results Tree on the other hand enables you to check out individual requests which can be helpful if you have 5xx responses. It looks like this:
The last thing you probably need is to send the Authorization header in your requests. In jmeter there's a dedicated component to set header values. It's called HTTP Header Manager and can be found in the Managers category. To set up is really easy you just need to add the header's name and value.
So a simple buf working test plan look like this:
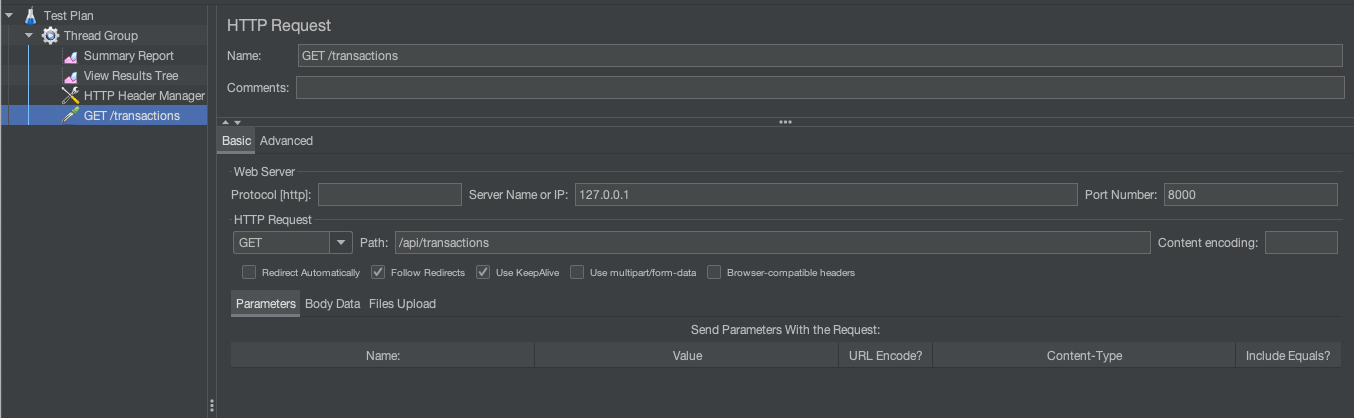
Note: you can find this example test plan in the source code 1-measuring-performance/simple-jmeter-test-plan.jmx
Inspector
ab and jmeter are great if you want to understand the throughput and overall responsiveness of your application. Let's say you found out that the GET /api/transactions endpoint is slow. Now what? You open the project go to the Controller trying to find the slow part. You might add some dd or time() and so on. Fortunately, there's a better way.
Inspector.dev allows you to visualize the internals of your application.
In fact, I like this tool so much that I asked the creators of the app to provide me a coupon code that I can share with you.
MARTINX30
It's a 30% discount for the first 12 months of your subscription.
For example, here's a time distribution of the different occurances of the GET /api/transactions request:
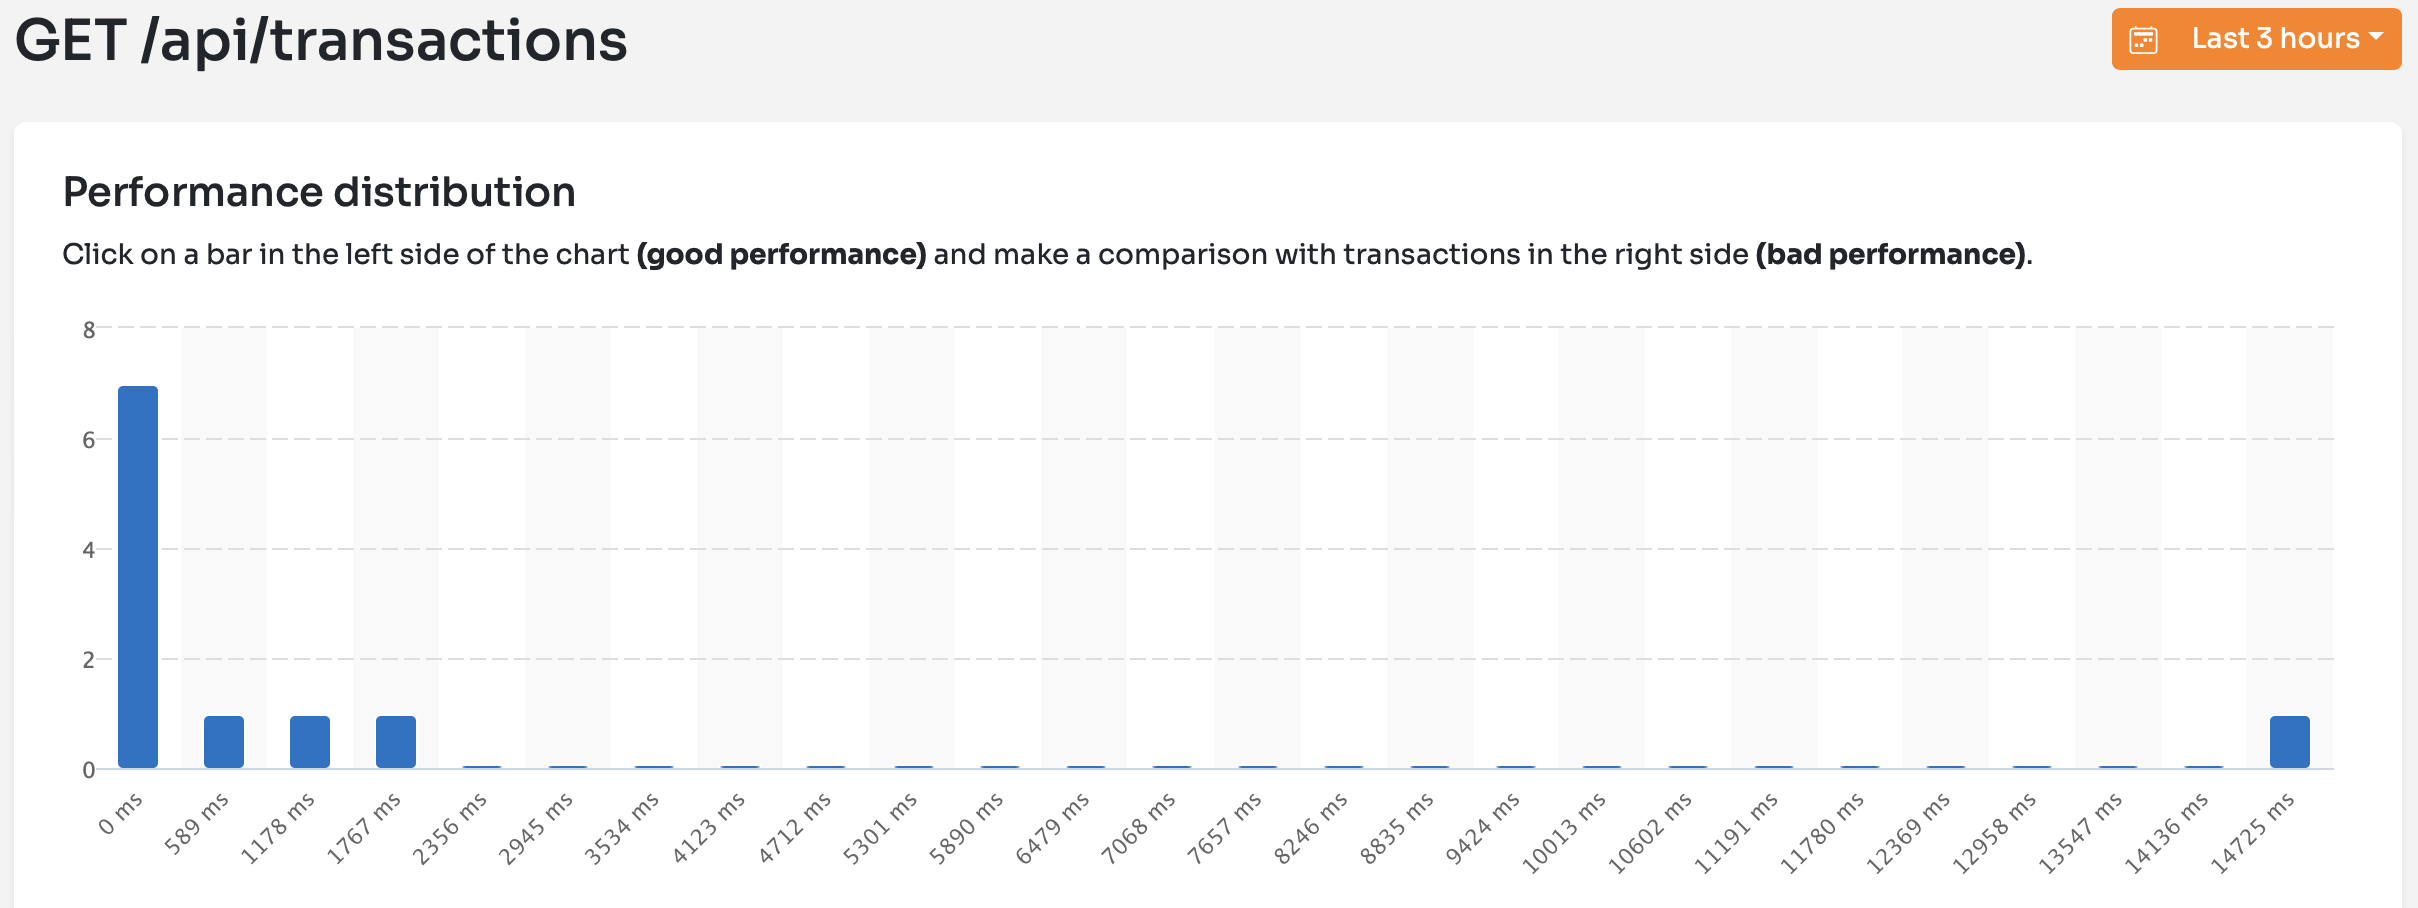
I sent the request 11 times:
- 7 times it took only 20-50ms. You can see these occurrences on the left side on the
0msmark. - 3 times it took something between 500ms and 2500ms. These are the 3 smaller bars.
- And then one time it took almost 15 seconds. This is the lonely bar at the right side.
If I click on these bars I can quickly see what's the difference between a 29ms and a 2300ms request:
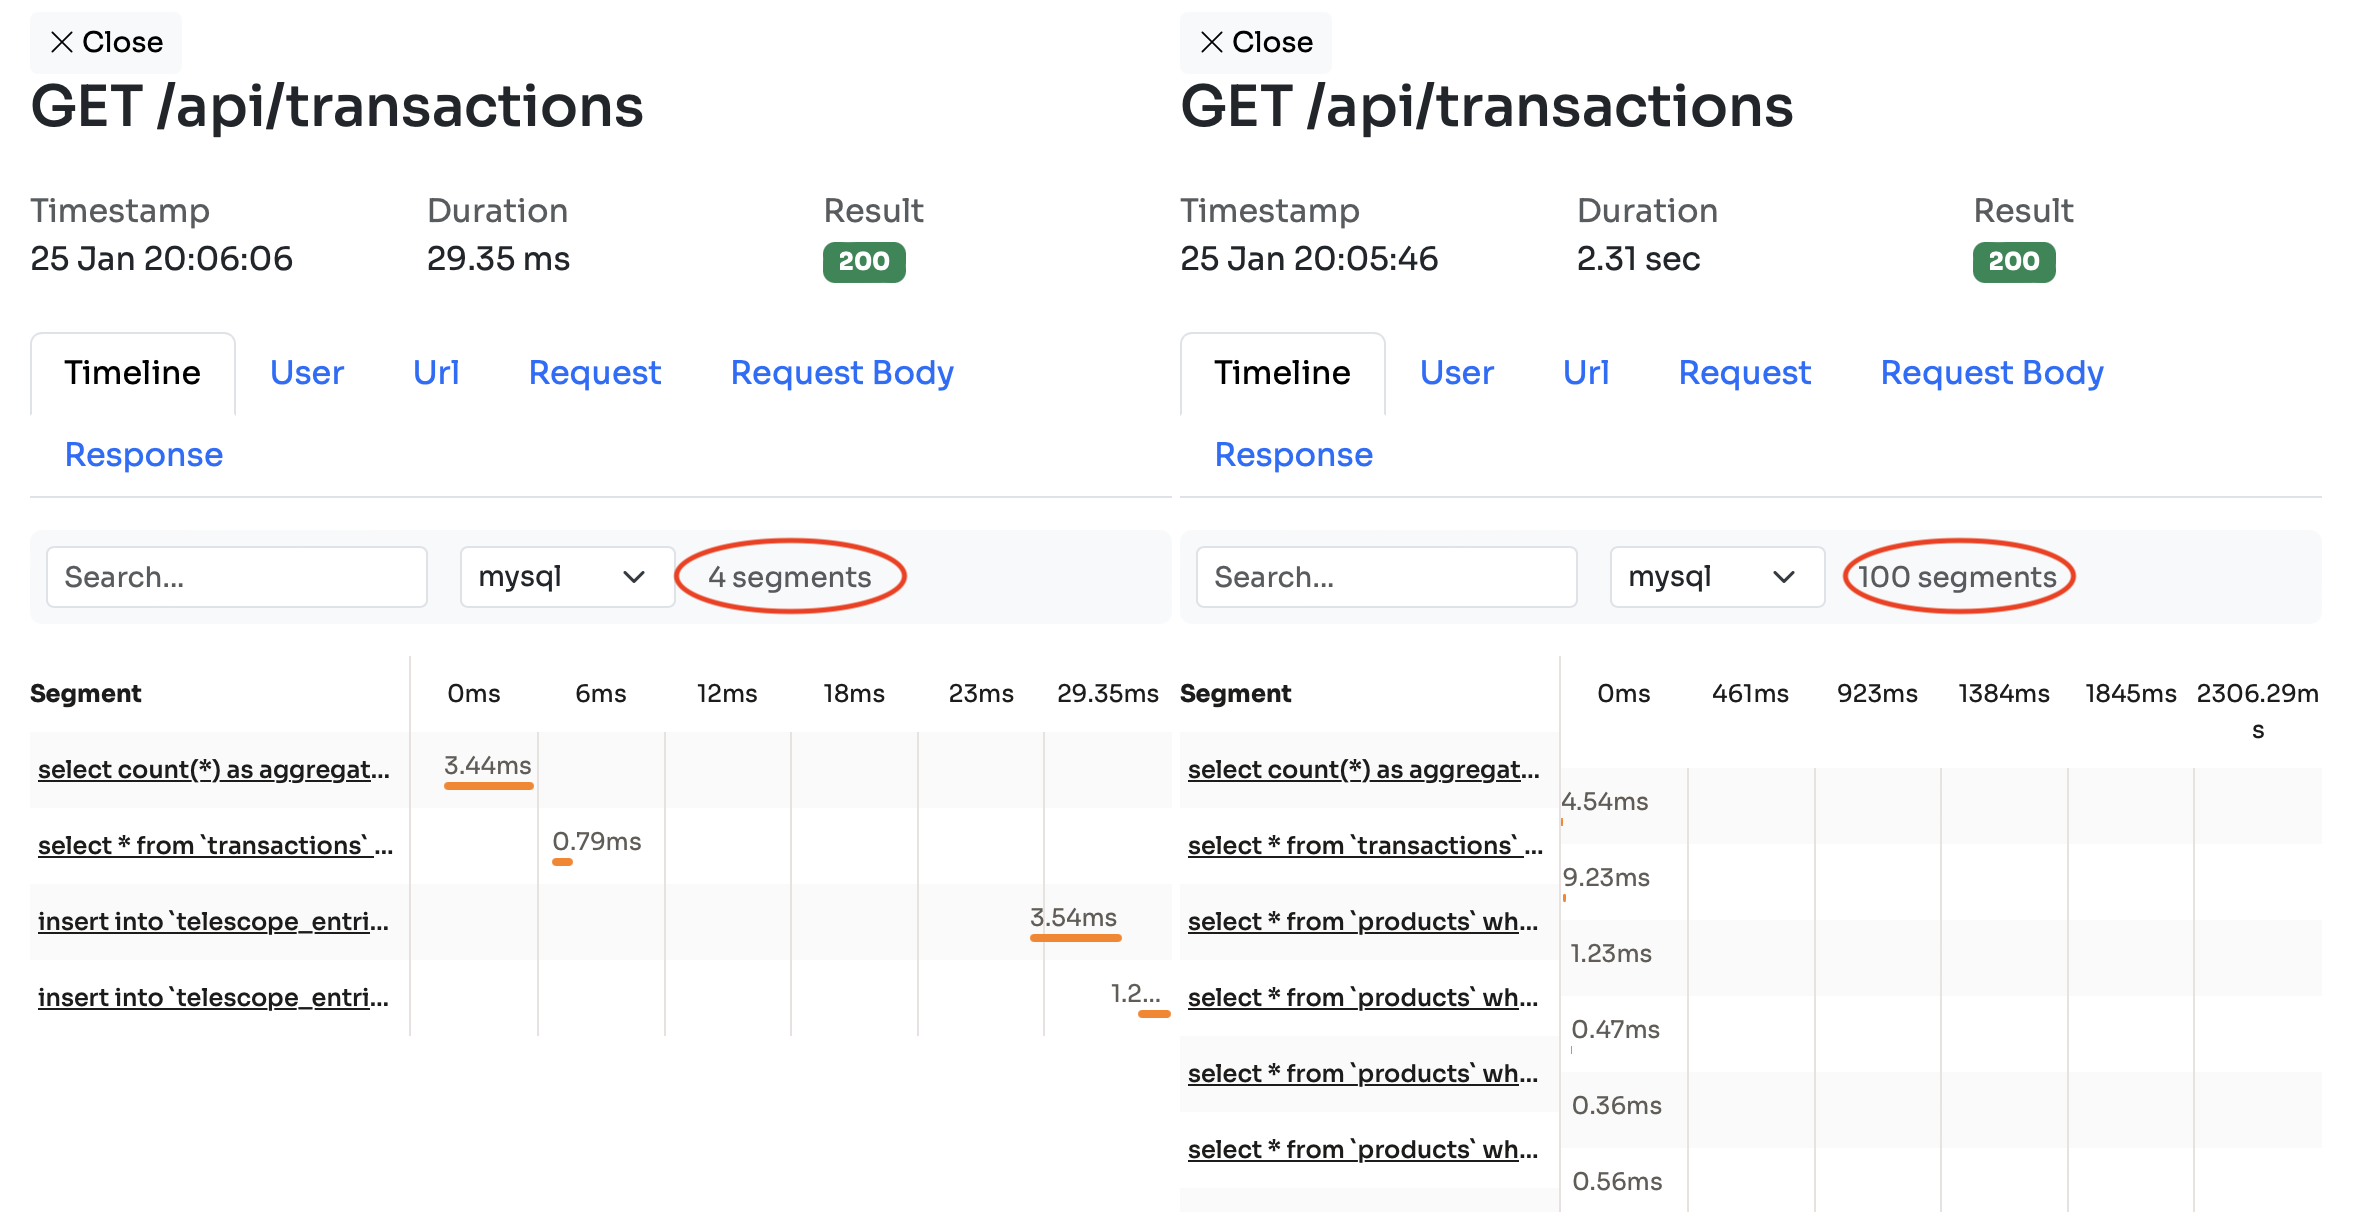
In the left panel you can see that only 4 mysql queries were executed and the request took 29ms to complete. On the right side, however, there were 100 queries executed and it took 2.31 seconds. You can see the individual queries as well. On the right side there are these extra select * from products queries that you cannot see on the left side.
In the User menu you can always check out the ID of the user that sent the request. It's a great feature since user settings and different user data can cause differences in performance.
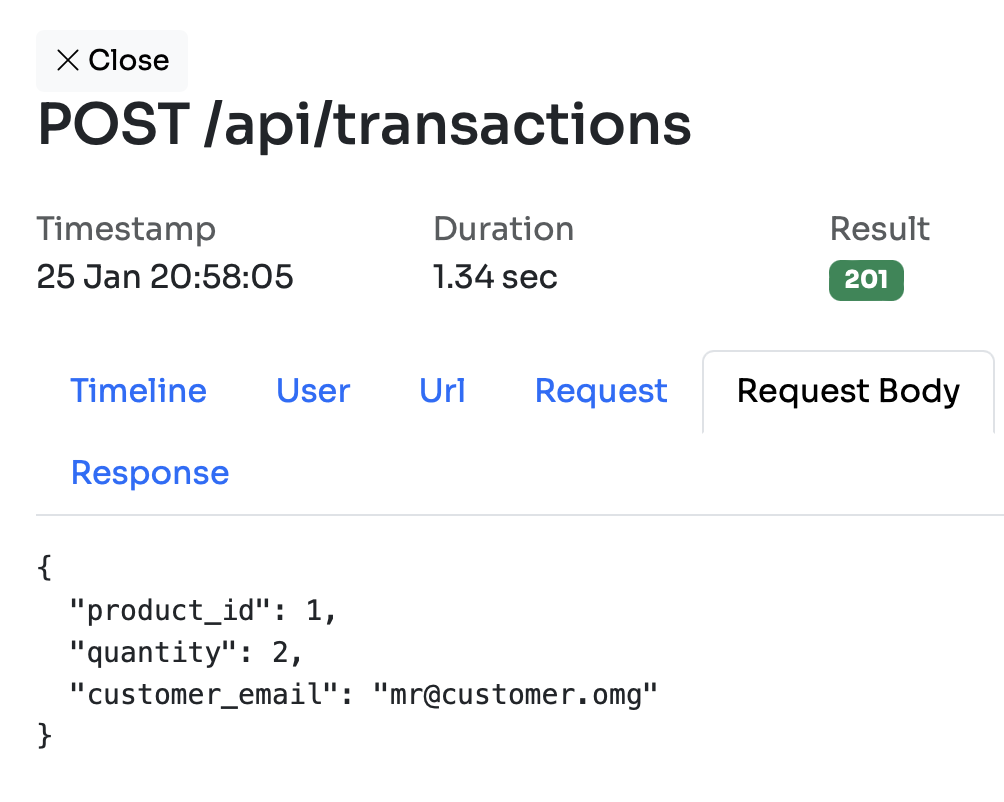
If it's a POST request you can see the body in the Request Body menu:
Another great feature of Inspector is that it also shows outgoing HTTP requests and dispatched jobs in the timeline:
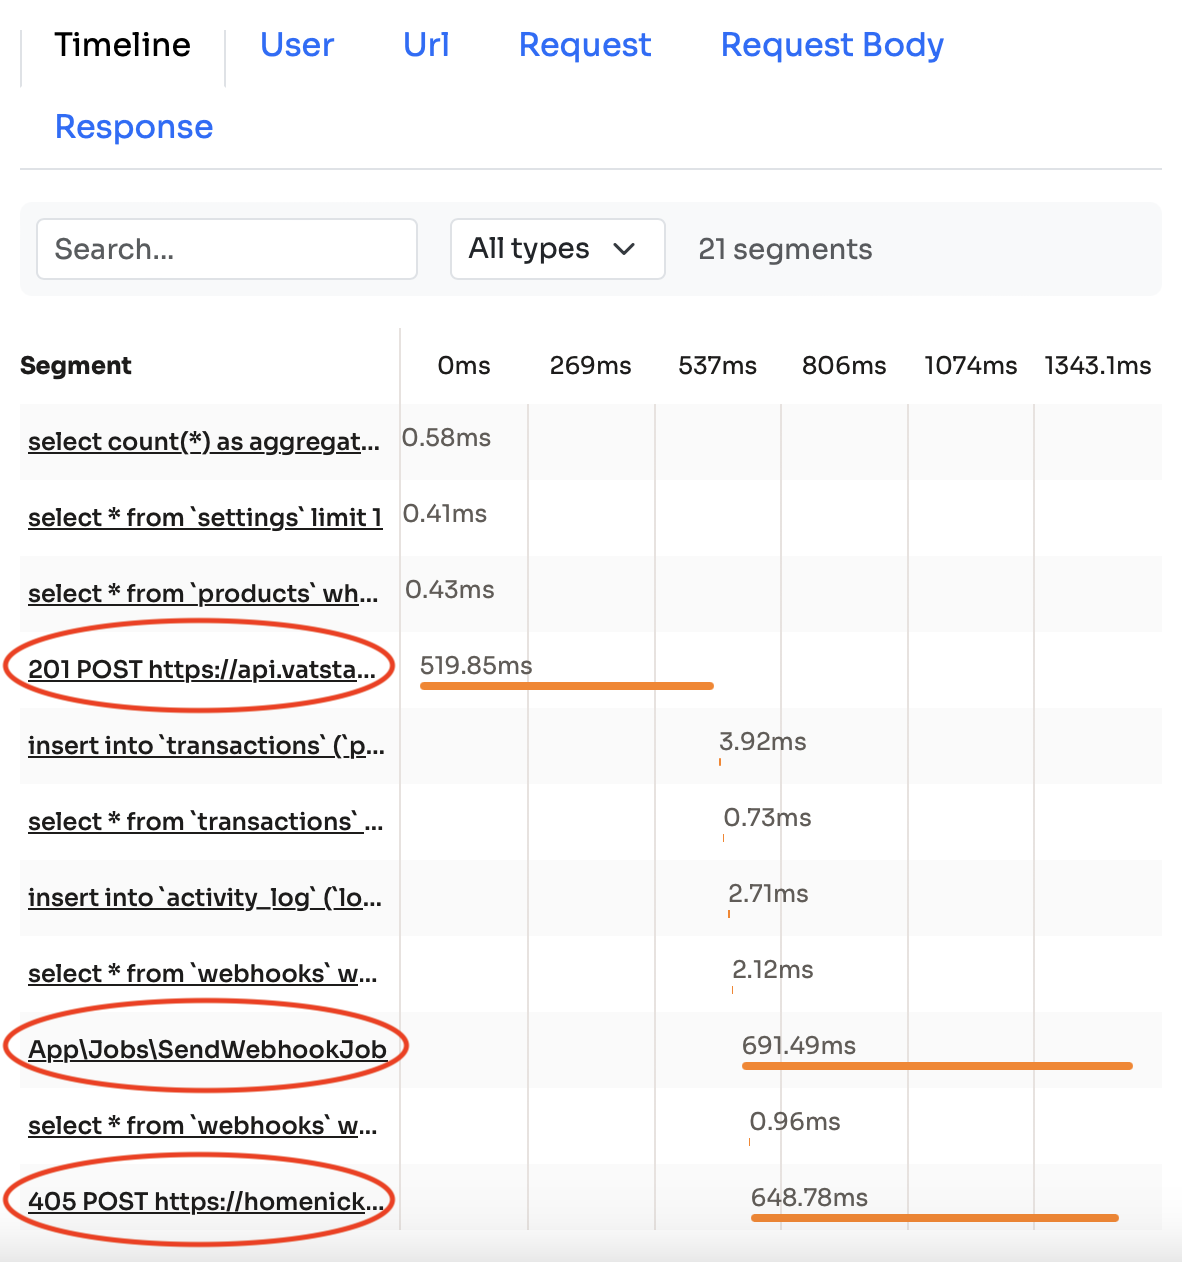
In my example application, the POST /api/transactions endpoint comunicates with other APIs and also dispatched a job. These are the highlighted rows on the image.
The great thing about Inspector is that it integrates with Laravel so it can detect things like your queue jobs:
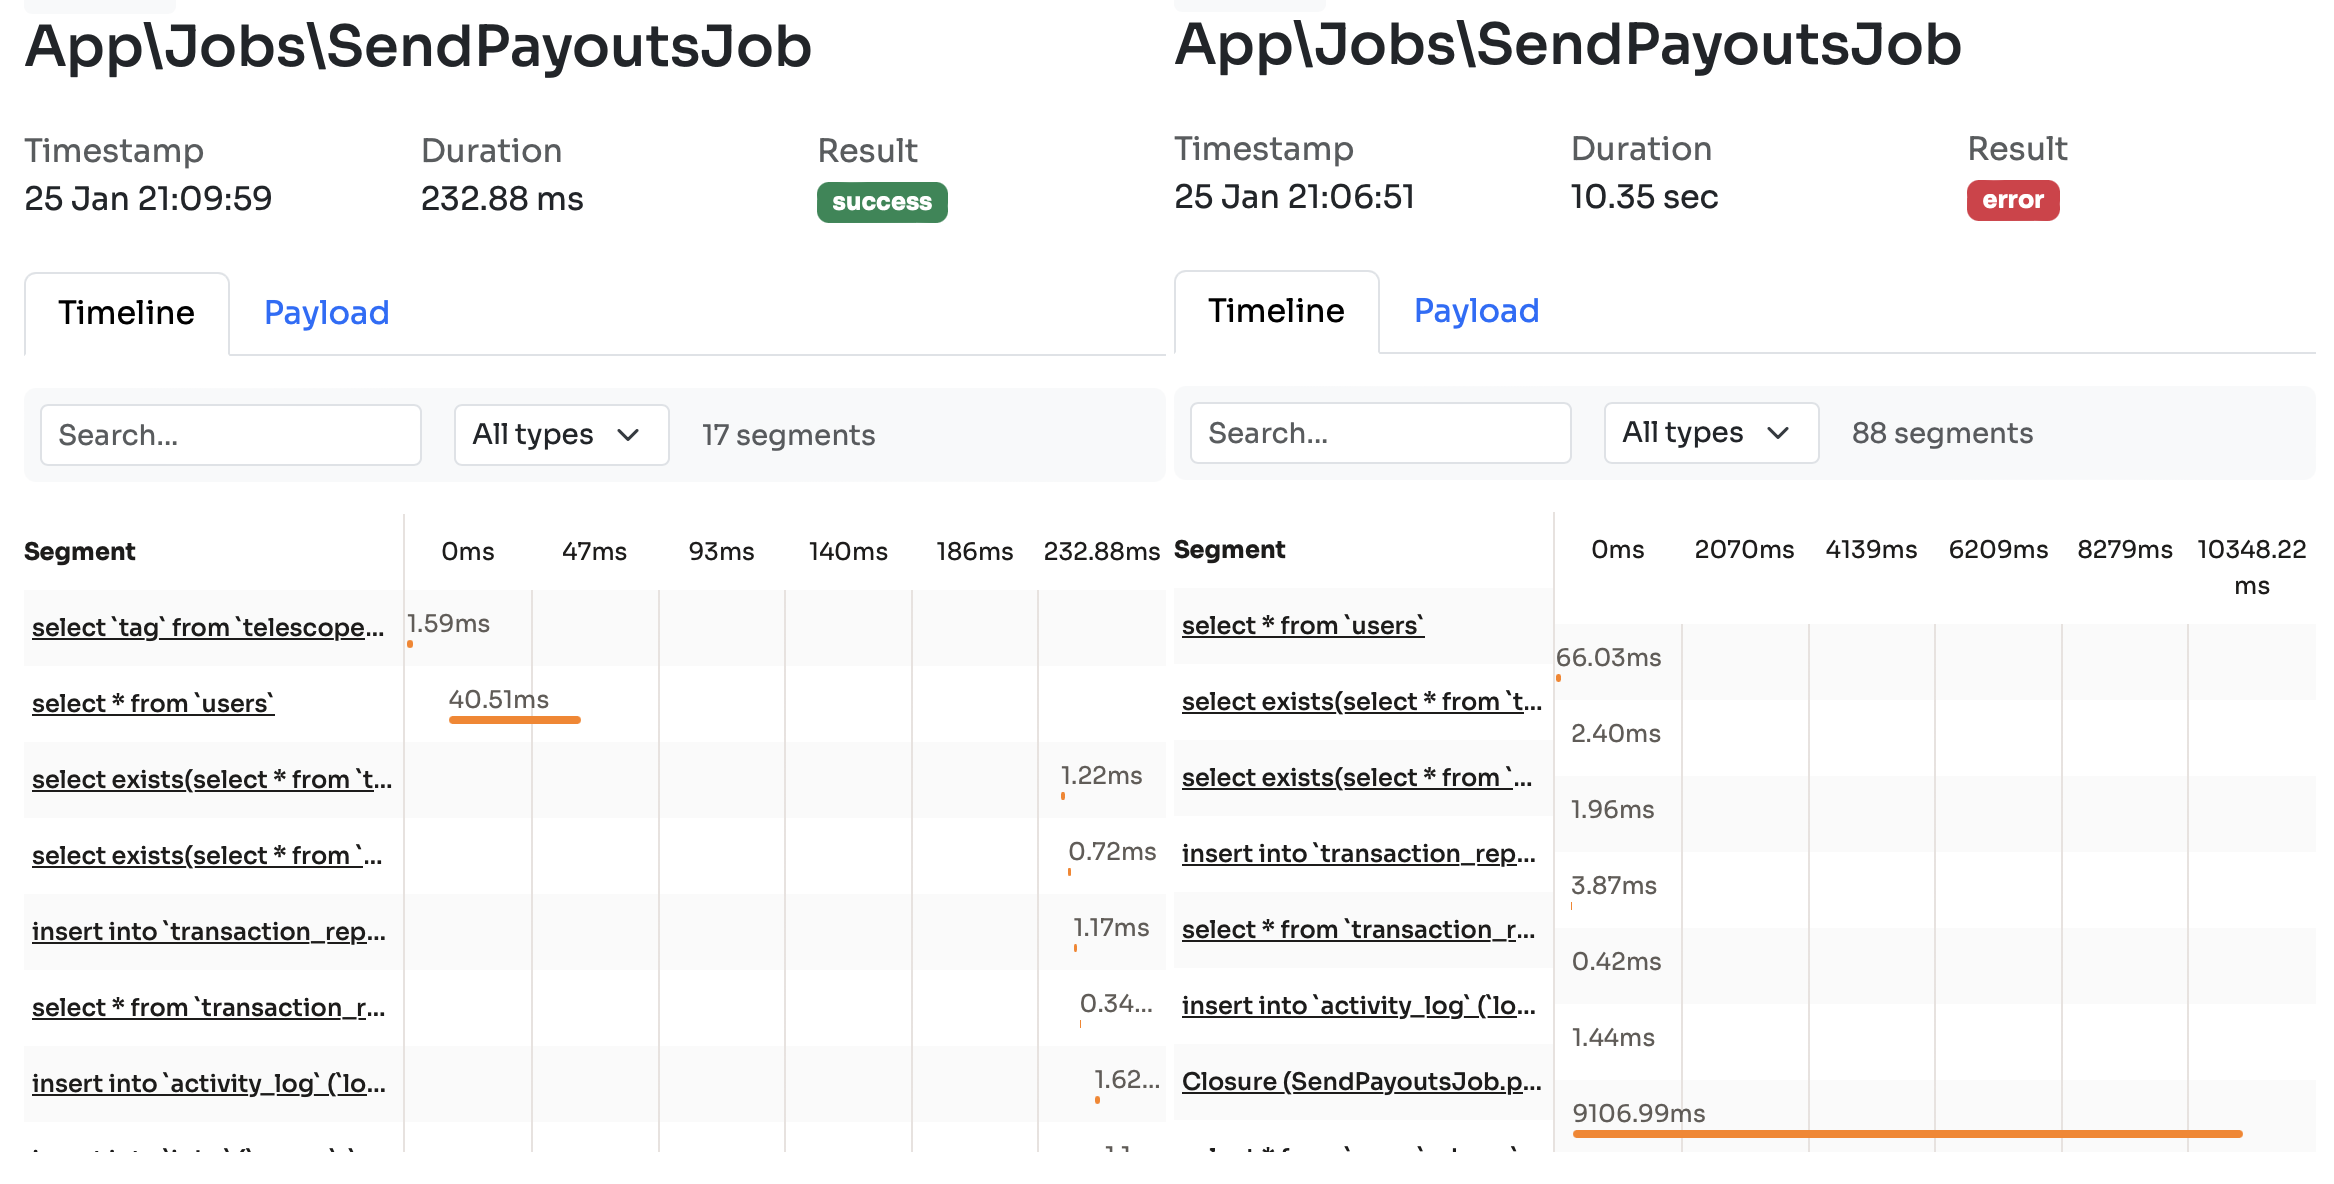
You can dig into the details of a jobs just like an HTTP requests:
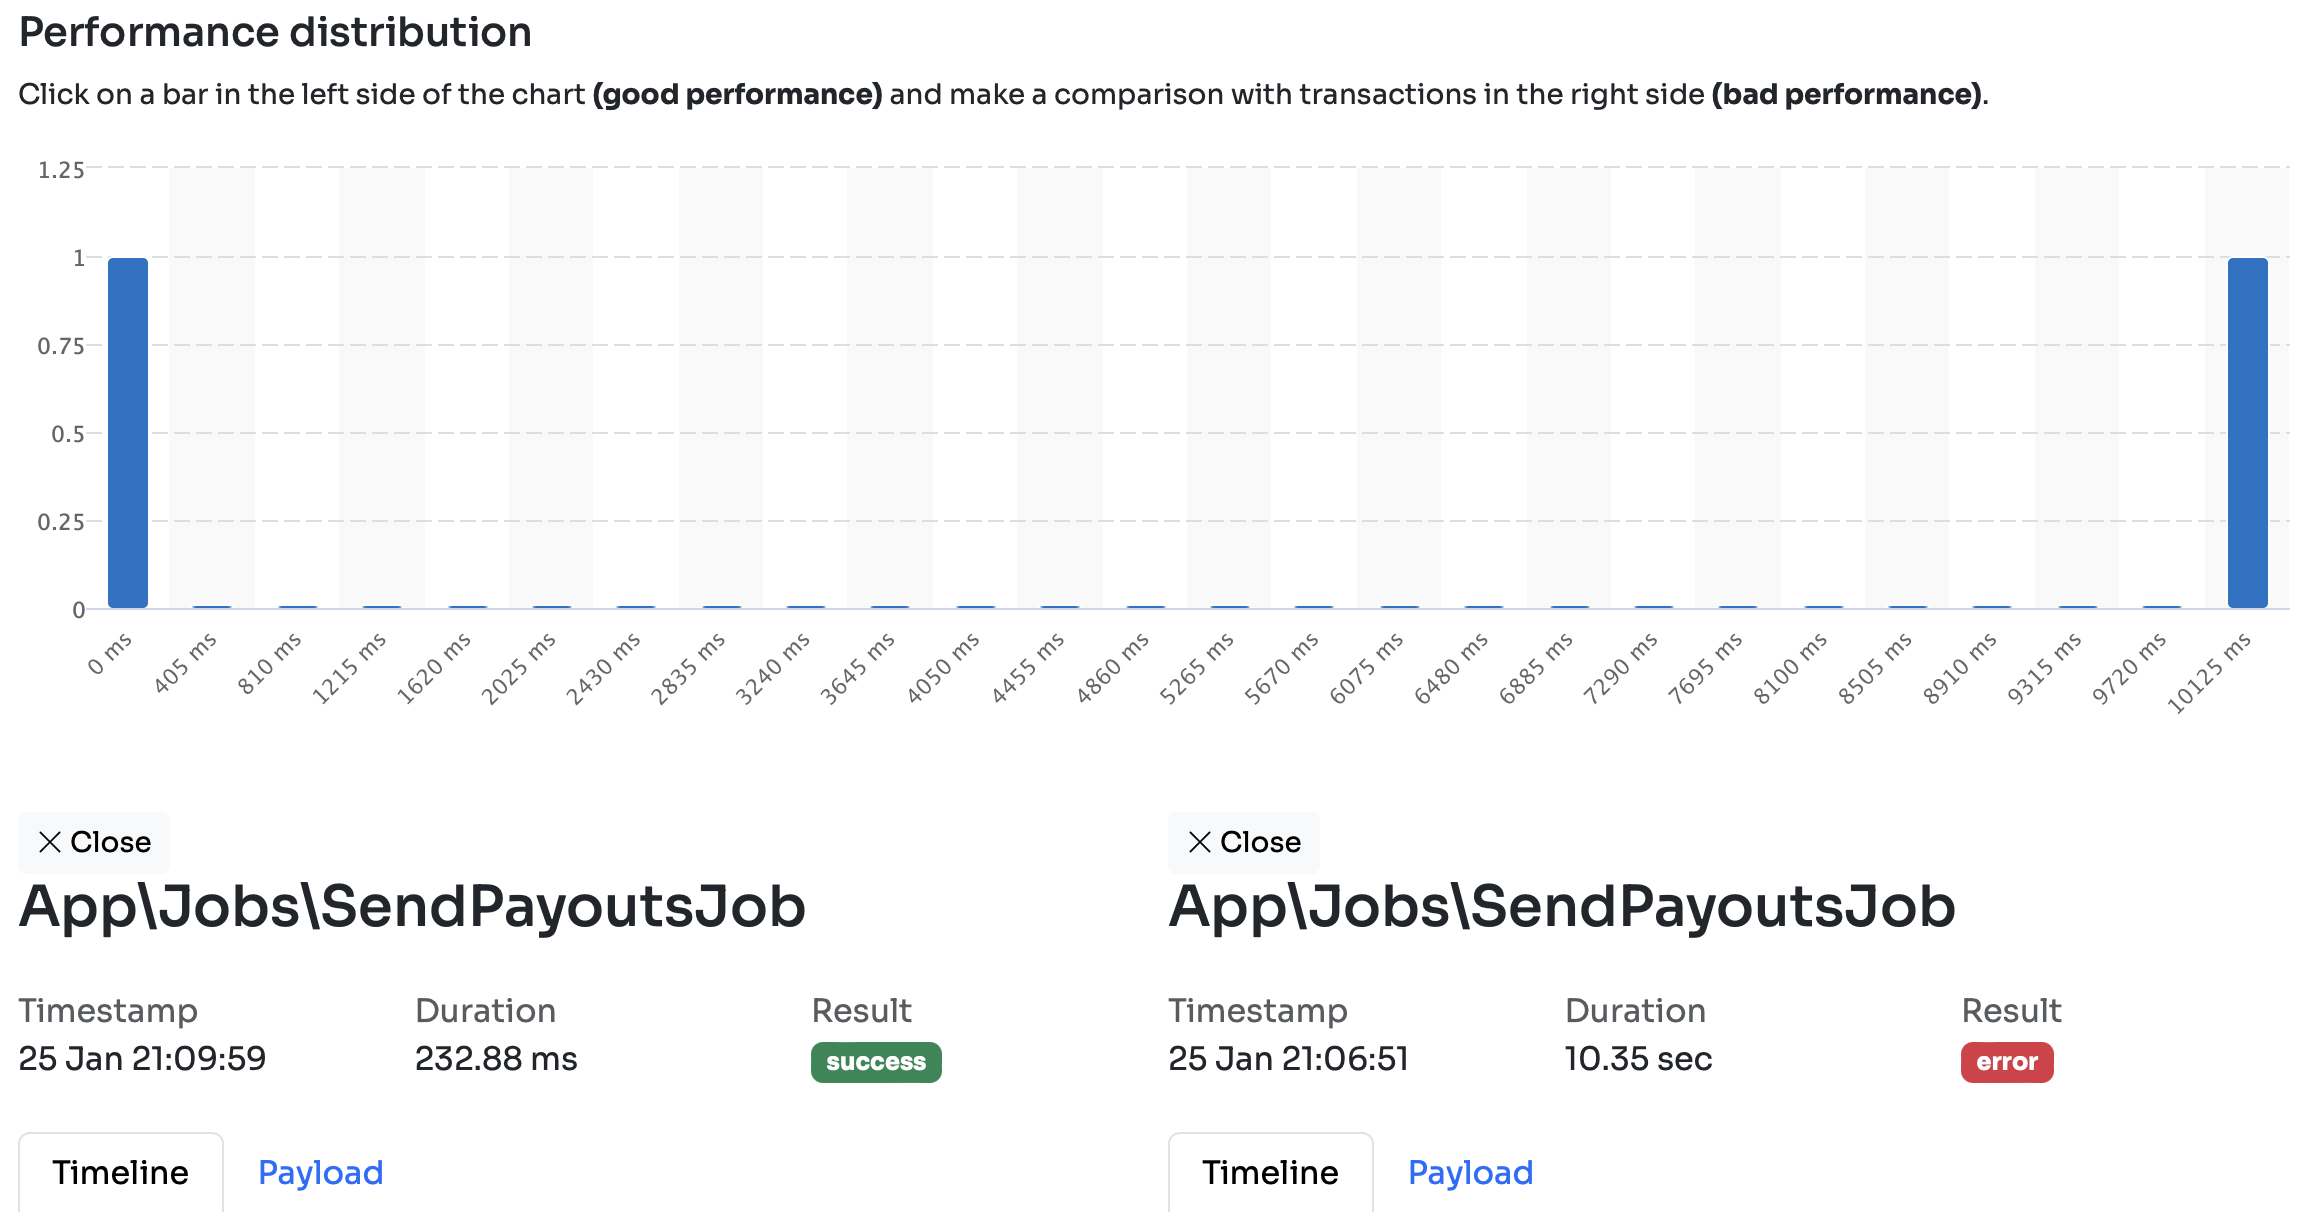
You have the same comparasion view with all the database queries, HTTP requests, or other dispatched jobs:
The best thing about Inspector? This is the whole installation process:
composer require inspector-apm/inspector-laravel
Inspector is a great tool, check out their docs here.
In fact, I like it so much that I asked the creators of the app to provide me a coupon code that I can share with you.
MARTINX30
It's a 30% discount for the first 12 months of your subscription.
Telescope
Even tough, Inspector is awesome, it's a paid 3rd party tool so I understand not everyone wants to use it.
One of the easiest tools you can use to monitor your app is Laravel Telescope.
After you've installed the package you can access the dashboard at localhost:8000/telescope. If you send some requests you'll see something like that:
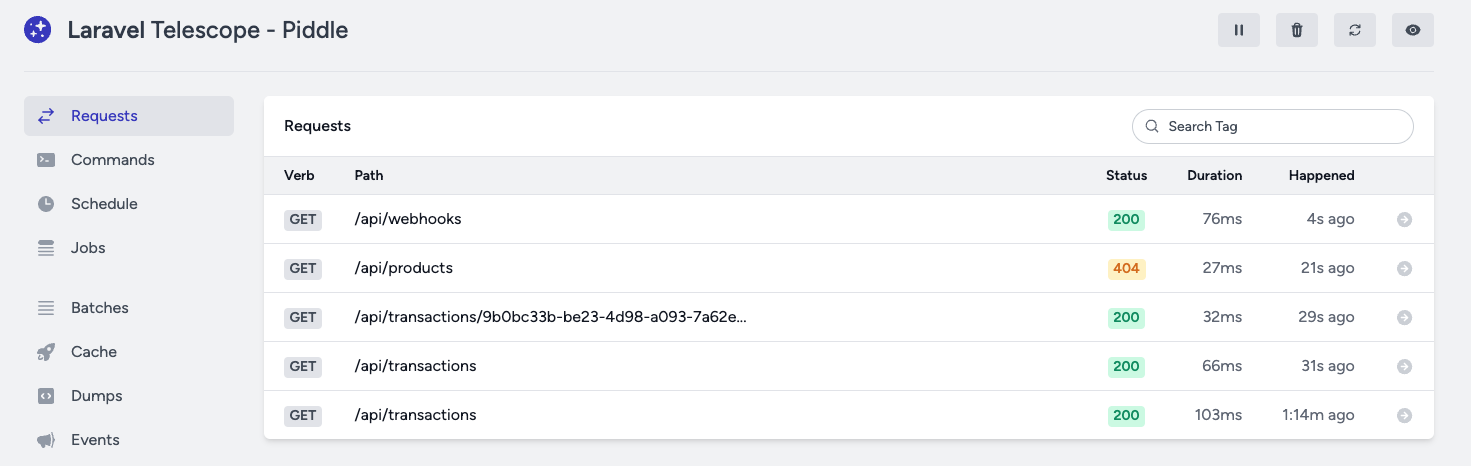
It gives you a great overview of your requests and their duration. What's even better, if you click on a specific request you can see all the database queries that were executed:
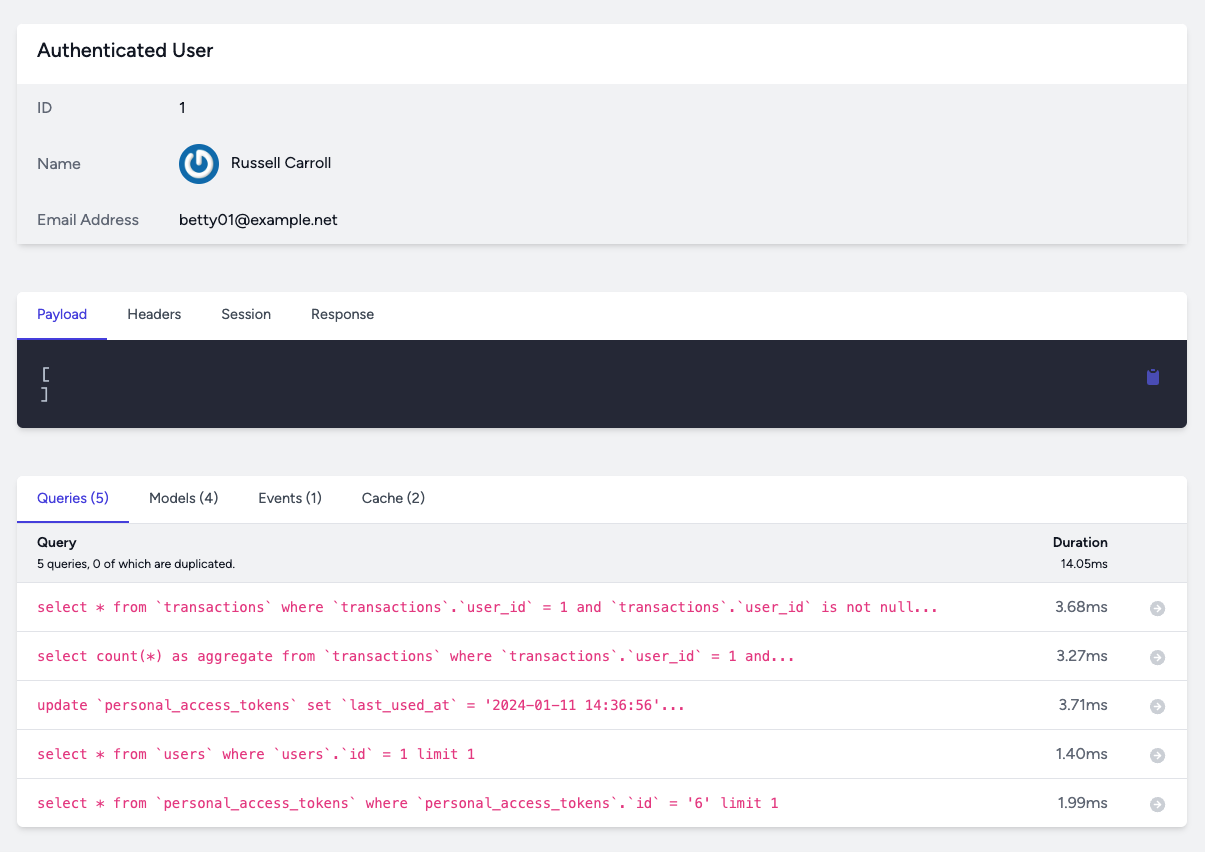
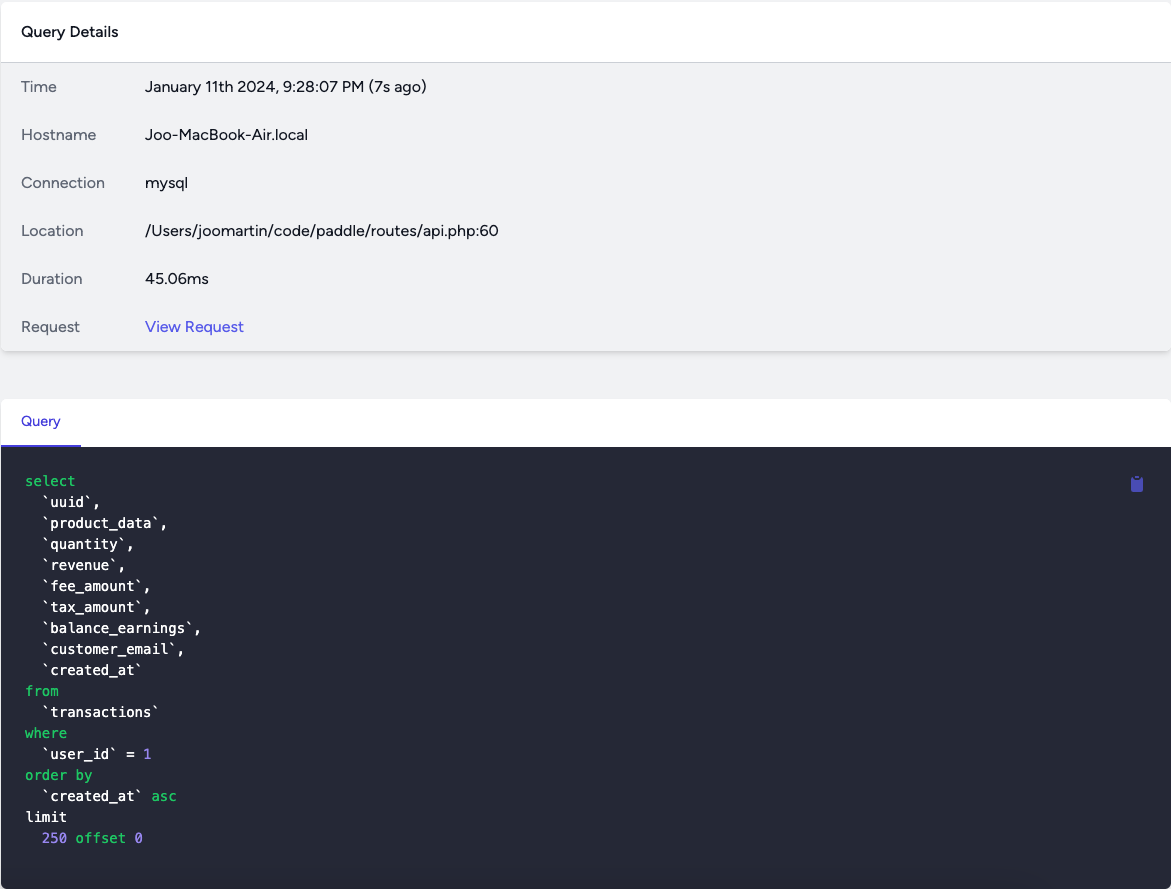
If you click on an entry you can see the whole query and the request's details:
Telescope can also monitor lots of other things such as:
- Commands
- Jobs
- Cache
- Events
- Exceptions
- Logs
- Mails
- ...and so on
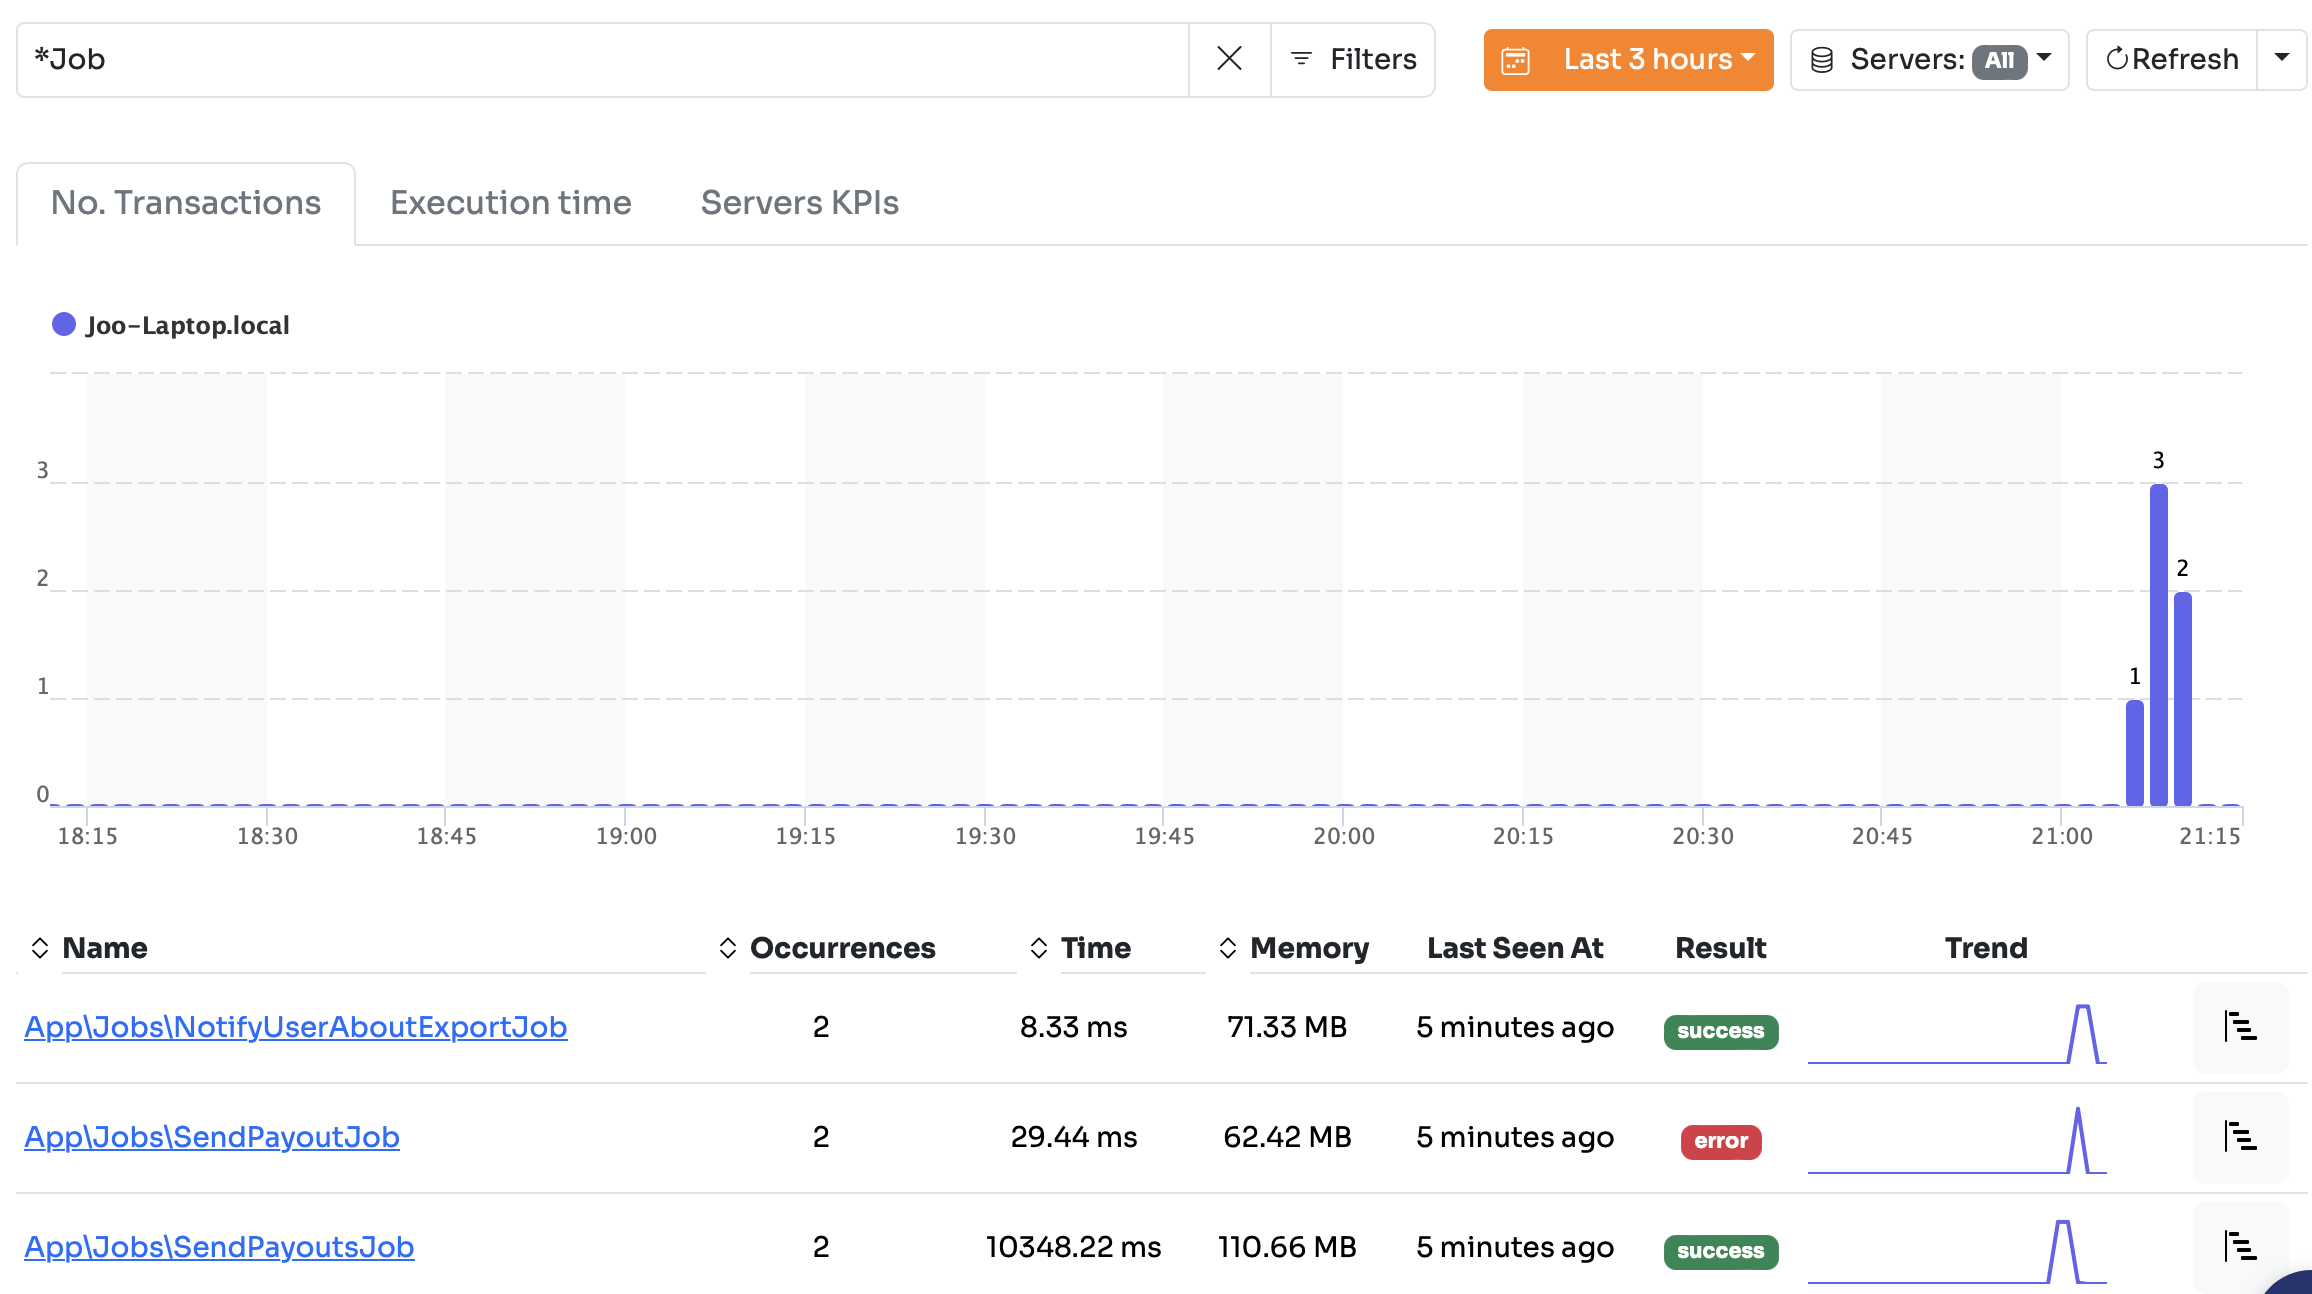
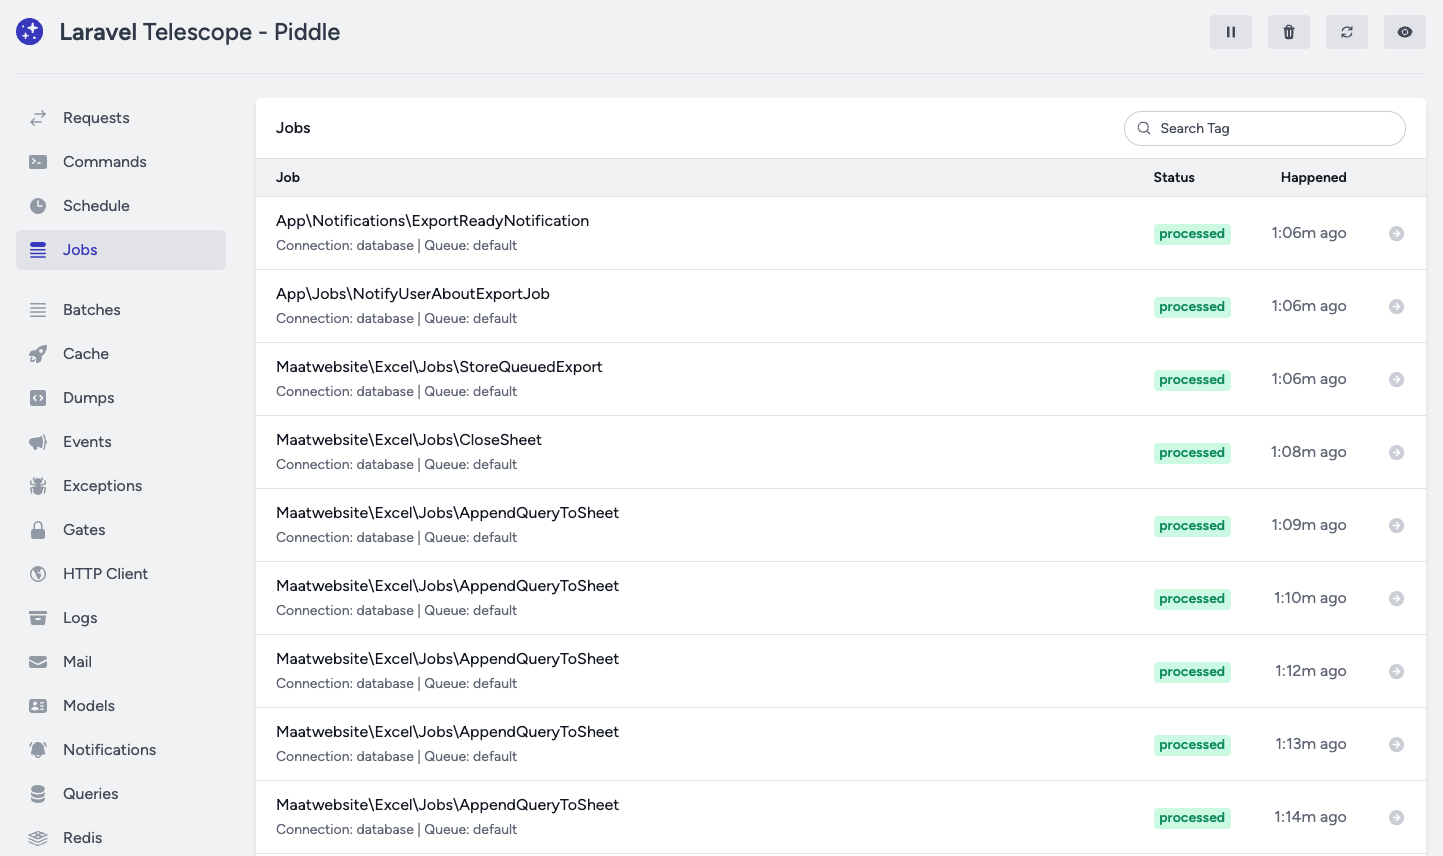
For example, here are some queue jobs after a laravel-excel export:
Telescope is a great tool and it's a must have if you want to monitor and improve your app's performance. If you want to use only free and simple tools go with ab and Telescope. ab tells you what part of the app is slow. Telescope tells you why it's slow.
OpenTelemetry
Both Inspector and Telescope tracks everything by default. Which is a great thing. However, sometimes you might want to control what's being tracked and what is not.
To do that, the best option in my opinion is OpenTelemetry. OpenTelemetry is an Observability framework and toolkit designed to create and manage telemetry data such as traces, metrics, and logs. It's independent of languages, tools, or vendors. It offers a standardized specification and protocol that can be implemented in any language.
There are two important OpenTelemetry terms, they are:
- Traces
- Spans
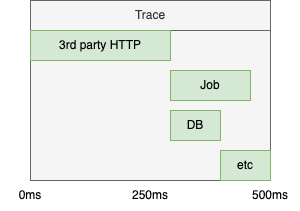
A trace is a set of events. It's usually a complete HTTP request and contains everything that happens inside. Imagine if your API endpoint sends an HTTP request to a 3rd, dispatched a jobs, sends a Notification and runs 3 database queries. All of this is one trace. Every trace has a unique ID.
A span is an operation inside a trace. The HTTP request to the 3rd party can be a span. The dispatched job can be another one. The notification can be the third one. And finally you can put the 3 queries inside another span. Each span has a unique ID and their contain the trace ID. It's a parent-child relationship.
We can visualize it like this:
So it's similar to Inspector, however, it requires manual instrumentation. Instrumentation means you need to start and stop the traces manually, and then you need to add spans as you like to. So it requires more work but you can customize it as you wish.
OpenTelemetry offers a PHP SDK. However, the bare bone framework is a bit complex to be honest, so I'll use a simple but awesome Spatie package to simplify the whole process. It's called laravel-open-telemetry.
The installation steps are easy:
composer require spatie/laravel-open-telemetry
php artisan open-telemetry:install
To start use it we need to manually add the spans:
Measure::start('Communicating with 3rd party');

Http::get('...');

Measure:stop('Communicating to 3rd party');
The start method starts a new span. Behind the scenes a unique trace ID will be generated at the start of every request. When you call Measure::start() a span will be started that will get that trace id injected. So we only worry about spans. Traces are handled by the package.
But what happens with this traces and spans? How can I view them? Great question!
The collected data needs to be stored somewhere and needs a frontend. We need to run some kind of store and connect it to the Spatie package. There are multiple tracing system that handles OpenTelemetry data. For example, ZipKin or Jaeger. I'm going to use ZipKin since it's the most simple to set up locally. All we need to do is this:
docker run -p 9411:9411 openzipkin/zipkin
Now the the Zipkin UI is available at http://localhost:9411.
In the open-telemetry.php config file we can condfigure the driver:
'drivers' => [
  Spatie\OpenTelemetry\Drivers\HttpDriver::class => [
    'url' => 'http://localhost:9411/api/v2/spans',
  ],
],
Now Spatie will send the collected metrics to localhost:9411 where ZipKin listens.
Let's see an example how we can add these spans. If you purchased one of my books (thank you very much!) you interacted with Paddle even if you didn't realize it. It's merchant of record meaning you paid for them and they will send me the money once a month. This way, I worry about only one invoice a month. They also handle VAT ramification.
So imagine an endpoint when we can buy a product, let's call it: POST /api/transactions the requests looks like this:
namespace App\Http\Requests;

class StoreTransactionRequest extends FormRequest
{
  public function rules(): array
  {
    return [
      'product_id' => ['required', 'exists:products,id'],
      'quantity' => ['required', 'numeric', 'min:1'],
      'customer_email' => ['required', 'email'],
    ];
  }
}
It's a simplified example, of course. When someone buys a product we need to do a number of things:
- Calculating the VAT based on the custumer's IP address
- Inserting the actual DB record
- Triggering a webhook meaning we call some user defined URLs with the transaction's data
- Moving money via Stripe. We'll skip that part now.
Calculating the VAT involves talking to 3rd party services (for example VatStack). The transactions table can be huge in an application like this so it's a good idea to place a span that contains this one query specifically.
We can add spans like these:
public function store(StoreTransactionRequest $request, VatService $vatService, Setting $setting)
{
  Measure::start('Create transaction');

  $product = $request->product();

  /** @var Money $total */
  $total = $product->price->multiply($request->quantity());

  Measure::start('Calculate VAT');

  $vat = $vatService->calculateVat($total, $request->ip());

  Measure::stop('Calculate VAT');

  $feeRate = $setting->fee_rate;

  $feeAmount = $total->multiply((string) $feeRate->value);

  Measure::start('Insert transaction');

  $transaction = Transaction::create([
    'product_id' => $product->id,
    'quantity' => $request->quantity(),
    'product_data' => $product->toArray(),
    'user_id' => $product->user_id,
    'stripe_id' => Str::uuid(),
    'revenue' => $total,
    'fee_rate' => $feeRate,
    'fee_amount' => $feeAmount,
    'tax_rate' => $vat->rate,
    'tax_amount' => $vat->amount,
    'balance_earnings' => $total->subtract($vat->amount)->subtract($feeAmount),
    'customer_email' => $request->customerEmail(),
  ]);

  Measure::stop('Insert transaction');

  try {
    if ($webhook = Webhook::transactionCreated($request->user())) {
      SendWebhookJob::dispatch($webhook, 'transaction_created', [
        'data' => $transaction,
      ]);
    }
  } catch (Throwable) {}

  Measure::stop('Create transaction');

  return response([
    'data' => TransactionResource::make($transaction)
  ], Response::HTTP_CREATED);
}
Here's the result in ZipKin:
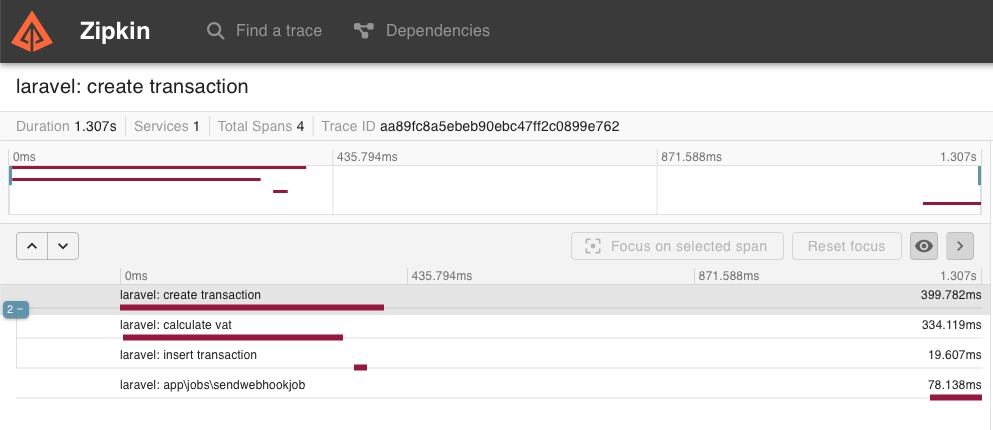
The trace is called laravel: create transaction where laravel comes from the default config of the package and create transaction comes from the first span.
There are four spans:
create transactionrefers to the whole methodcalculate vattracks the communication with VatStackinsert transactiontracks the DB query- And finally
SendWebhookJobwas recorded by the package automatically. It tracks every queue job by default and puts them into the right trace. It's a great feature of the Spatie package.
Unfortunately, it's not perfect. You can see the duration is 1.307s in the upper left corner that refers to the duration of the whole trace. But it's not true since the operation took only 399ms + 78ms for the job. Since the job is async there's a delay in dispatching it and the start of the execution by the worker process. I honestly don't know how we can overcome this problem.
In retrospect, here's the same endpoint in Inspector:
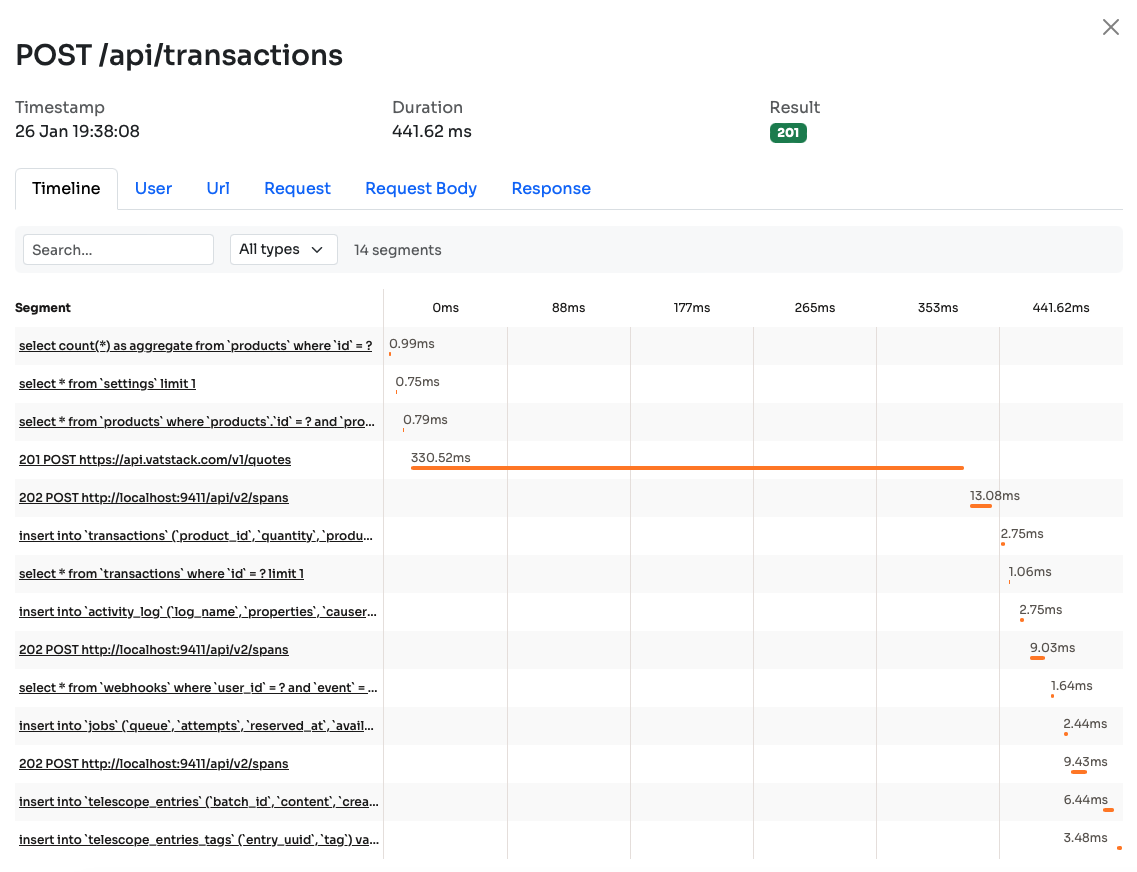
The duration is much better and I think the timeline is also better. Of course, it's more detailed. If these small 5ms segments are annoying I have good news. You can group them using segments:
$vat = $vatService->calculateVat($total, $request->ip());

inspector()->addSegment(function () {
  $feeRate = $setting->fee_rate;
  $feeAmount = $total->multiply((string) $feeRate->value);
  //...
}, 'process', 'Group #1');
Group #1 will be displayed in Inspector as the name of this segment. Instead of 10 small segments you'll see only one. It's a great feature if you're in the middle of debugging and you want to see less stuff to have a better overview of your endpoint.
To sum it up:
- OpenTelemetry is a great tool to profile your apps
- You have to add your own spans which gives you great customization
- On the other hand, you have to invest some time upfront
- It's free. However, you still need to deploy ZipKin somewhere
Compare it to Inspector:
- You just install a package
- You'll see every detail
- You can still add your own segments to customize the default behavior
- But of course, it's a paid service
XDebug + qcachegrind
The next profiling tool is lowest-level of all. It might not be the most useful but I felt I had to include at least one low-level tool.
XDebug can be used in two ways:
- Step debugging your code
- Profiling your code
Lots of people know about the step debugging aspect of it. And it's great. I think you should set it up and use it. Here's a Jeffrey Way video that teaches you the whole process in 11 minutes and 39 seconds.
The other feature of XDebug is profiling. When you send a request to your app it can profile every method call and creates a pretty big data structure out of it that can viewed and analysed for performance problems. The programs that allows you the view these structures is called qcachegrind on Mac and kcachegrind on Linux.
You can install these two programs on Mac by running these:
pecl install xdebug
brew install qcachegrind
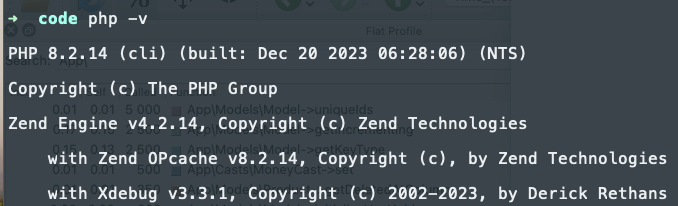
If you run php -v you should see something like this:
After that we need to configure XDebug in php.ini:
zend_extension=xdebug
xdebug.profiler_enabled=1
xdebug.mode=profile,debug
xdebug.profiler_output_name=cachegrind.out.%c
xdebug.start_upon_error=yes
xdebug.client_port=9003
xdebug.client_host=127.0.0.1
xdebug.mode=profile makes it to listen to our requests and create a function call map. xebug.profiler_output_name is the file that it creates in the /var/tmp directory. client_port and client_host is only needed to step debugging.
If you're not sure where is your php.ini file run this:
php --ini
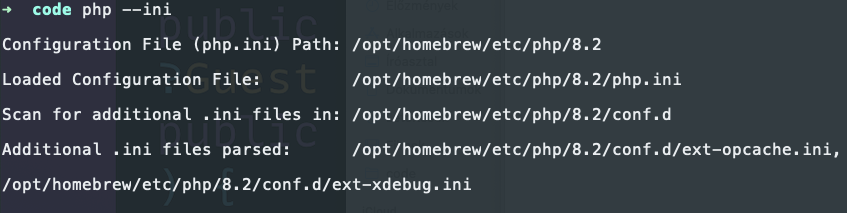
As you can see, I didn't add the XDebug config in the php.ini file but created an ext-xdebug.ini file in the conf.d folder that is automatically loaded by PHP.
Now you need to restart your php artisan serve, or Docker container, or local fpm installation. If you did everything right phpinfo() should include the XDebug extension.
Now all you need to do is send a request to your application. After that, you should see a new file inside the /var/tmp directory:
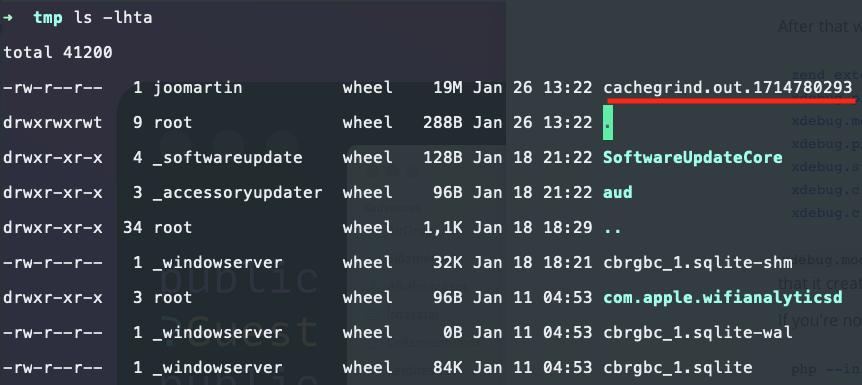
Let's open it:
qcachegrind cachegrind.out.1714780293
We see something like that:
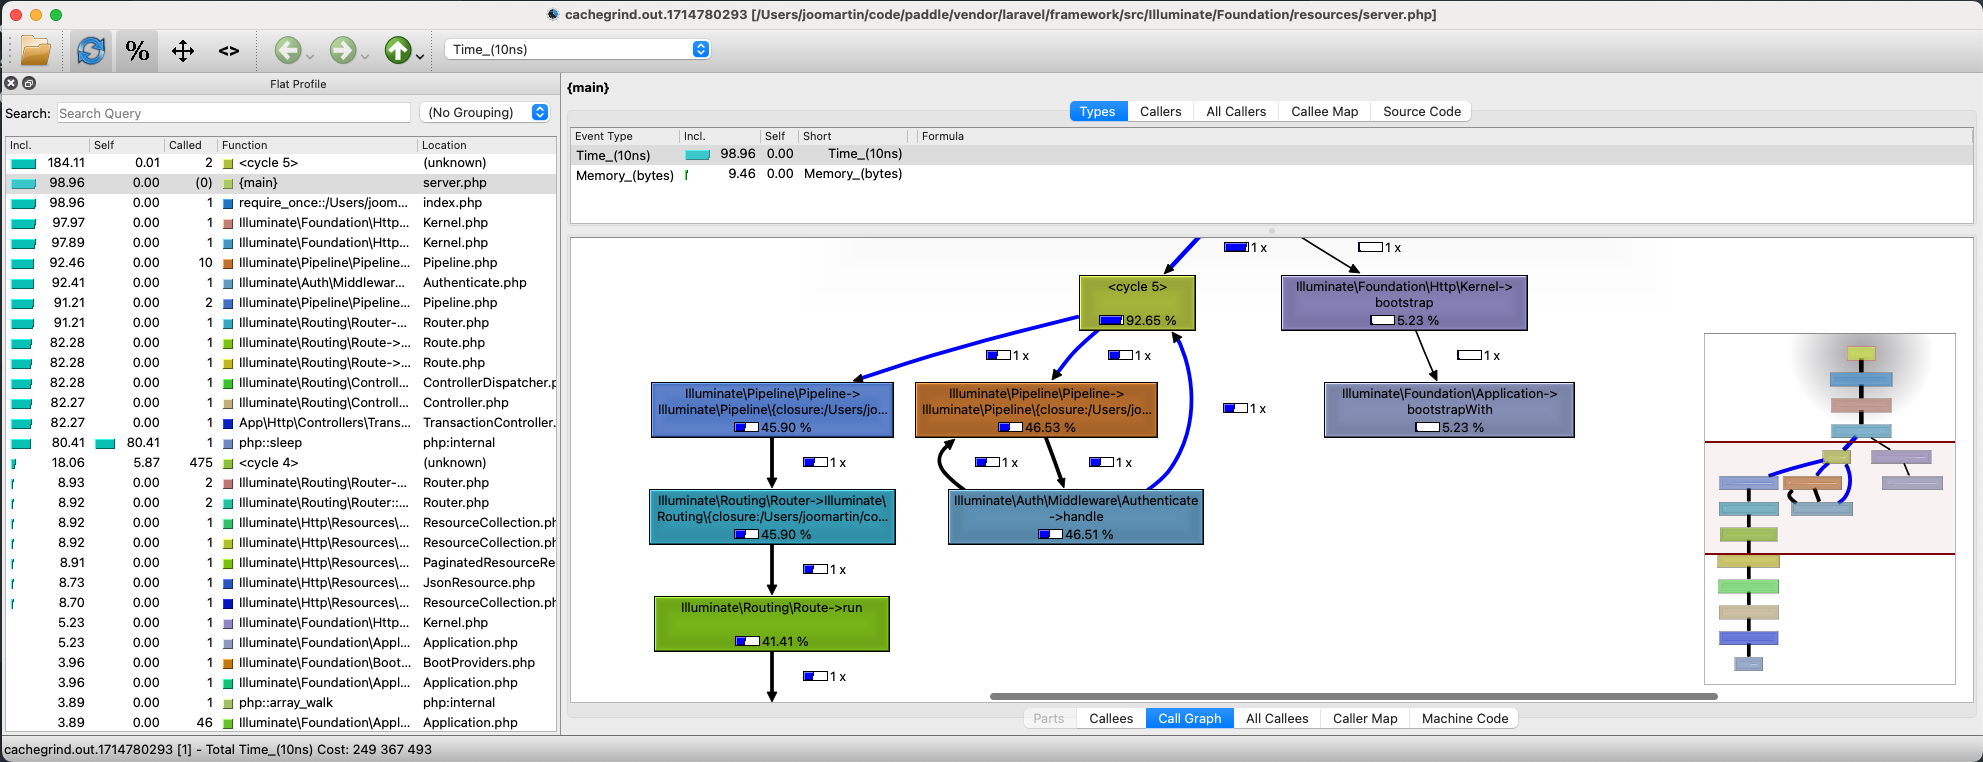
It's a little bit old school, it's a little ugly, but it's actually pretty powerful.
On the left side you see every function that was invoked during the requests.
On the right side you see the full call graph.
The great thing about the call graph is that it includes the time spent in the given function. Take a look at this:
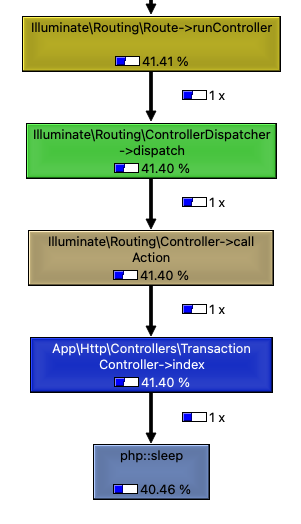
This is the part where Laravel dispatches my TransactionController class and calls the index method in which I put a sleep function. 40% of the time was spent in the sleep function which is expected in this case.
The great thing about XDebug+qcachegrind is that you can really dig deep into your application's behavior. However, I think in most cases it's unnecessary. With Telescope or Inspector you'll get a pretty great overview of your performance problems. In a standard, high-level, "business" application your problems will be most likely related to database and Telescope or Inspector are just better tools to profile these kinds of problems.
However, XDebug+qcachegrind can teach us a few things. For example, I never realized this:
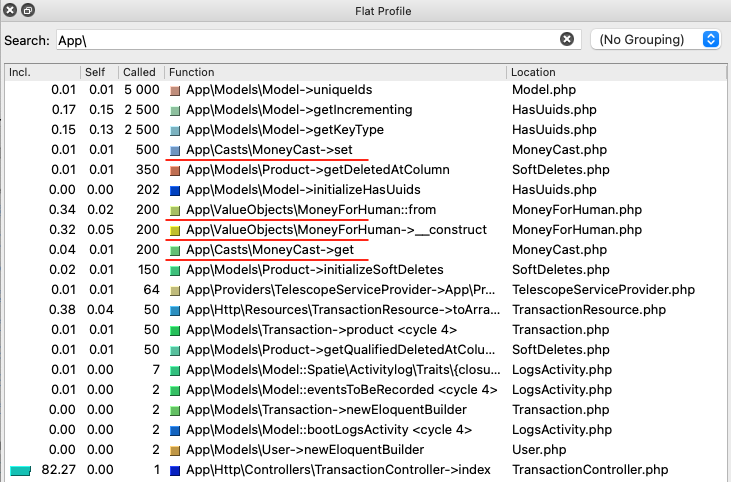
These are the function that were executed during the requests. I highlighted four of them:
MoneyCast::setwas called 500 timesMoneyForHuman::fromwas called 200 timesMoneyForHuman::__constructwas called 200 timesMoneyCast::getwas called 200 times
I give you some context. These examples come from a financial app. The requests I was testing is the GET /api/transactions. It returns 50 transactions. A transacion record looks like this:
| ID | product_id | quantity | revenue |
|---|---|---|---|
| 1 | 1 | 2 | 1800 |
| 2 | 1 | 1 | 900 |
| 3 | 2 | 1 | 2900 |
It containes a sales of a product. It has other columns as well.
The Transaction model uses some value object casts:
class Transaction extends Model
{
  use HasFactory;

  protected $casts = [
    'quantity' => 'integer',
    'revenue' => MoneyCast::class,
    'fee_rate' => PercentCast::class,
    'fee_amount' => MoneyCast::class,
    'tax_rate' => PercentCast::class,
    'tax_amount' => MoneyCast::class,
    'balance_earnings' => MoneyCast::class,
    'product_data' => 'array',
  ];
}
MoneyCast is just a Cast that uses the Money value object from the moneyphp package:
class MoneyCast implements CastsAttributes
{
  public function get(Model $model, string $key, mixed $value, array $attributes): mixed
  {
    return Money::USD($value);
  }

  public function set(Model $model, string $key, mixed $value, array $attributes): mixed
  {
    return $value->getAmount();
  }
}
Pretty simple. The database stores scalar values and this Cast casts them into value objects.
The TransactionController return with TransactionResource objects:
class TransactionResource extends JsonResource
{
  public function toArray(Request $request): array
  {
    return [
      'uuid' => $this->uuid,
      'quantity' => $this->quantity,
      'revenue' => MoneyForHuman::from($this->revenue)->value,
      'fee' => MoneyForHuman::from($this->fee_amount)->value,
      'tax' => MoneyForHuman::from($this->tax_amount)->value,
      'balance_earnings' => MoneyForHuman::from($this->balance_earnings)->value,
      'customer_email' => $this->customer_email,
    ];
  }
}
There are thse MoneyForHuman calls. It's just another value object that formats Money objects.
The important part is that the Controller returns only 50 transactions:
return TransactionResource::collection(
  $request->user()->transactions()->paginate(50),
);
Returning only 50 transactions resulted in 1,100 calls to these objects and functions!
It's crazy. If I put something in one of these classes that takes only 50ms the whole request will take an extra 5,500ms to complete. That is an extra 55 seconds.
Let's try it out!
These are the base results without slowing down the functions:
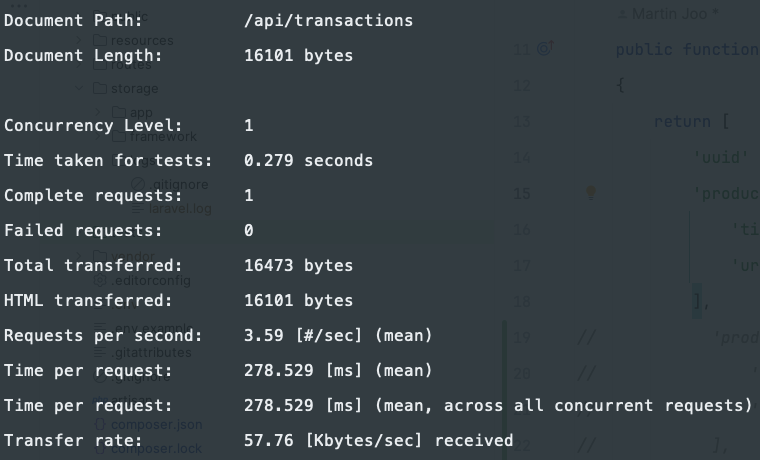
I sent only one request and it took 278ms to complete. Of course, it will vary but it's good enough.
And now I put 3 usleep(55000); calls in the code:
class MoneyForHuman
{
  public function __construct(private readonly Money $money)
  {
    usleep(55000);
    // ...
  }
}

class MoneyCast implements CastsAttributes
{
  public function get(): mixed
  {
    usleep(55000);
    // ...
  }

  public function set(): mixed
  {
    usleep(55000);
    // ...
  }
}
At first try, ab timout was exceeded which is 30 seconds by default:
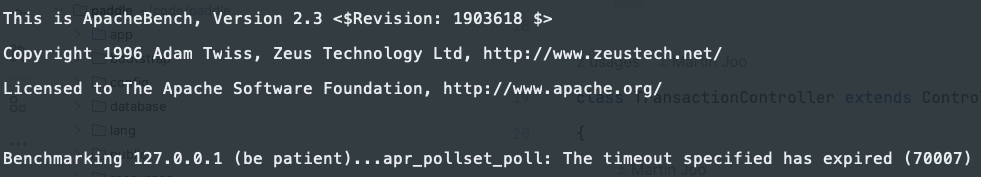
Let's increase it:
ab -n 1 -s 300 -H "Authorization: Bearer 5|JkQOThREkfVgcviCdfEEAU74WRyGHo1ZuKujG4fA" http://127.0.0.1:8000/api/transactions
And the results are:
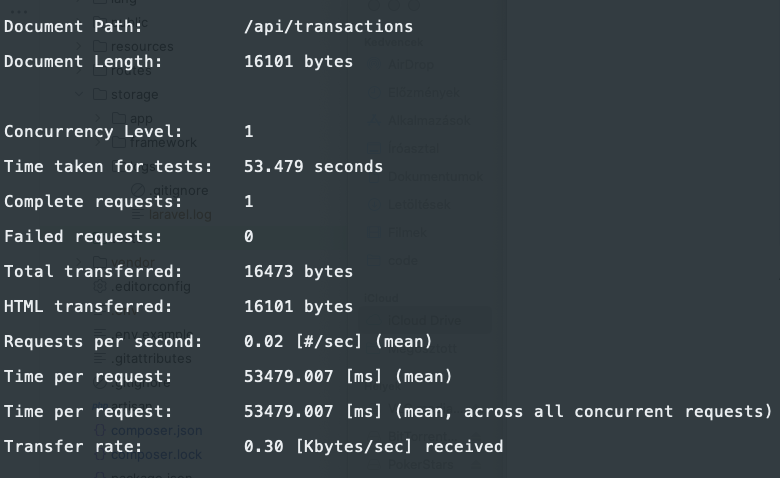
The request took 53.5 seconds to complete.
So even tough, XDebug+qcachegrind can be a little bit too low-level for 95% of our usual performance problems as you can see they can help us to see the small details that can ruin the performance of our applications in some cases.
If you want to learn more about XDebug+qcachegrind check out this live stream from the creator of XDebug.
This whole article comes from my upcoming book Performance with Laravel.
Join the waiting list here: